


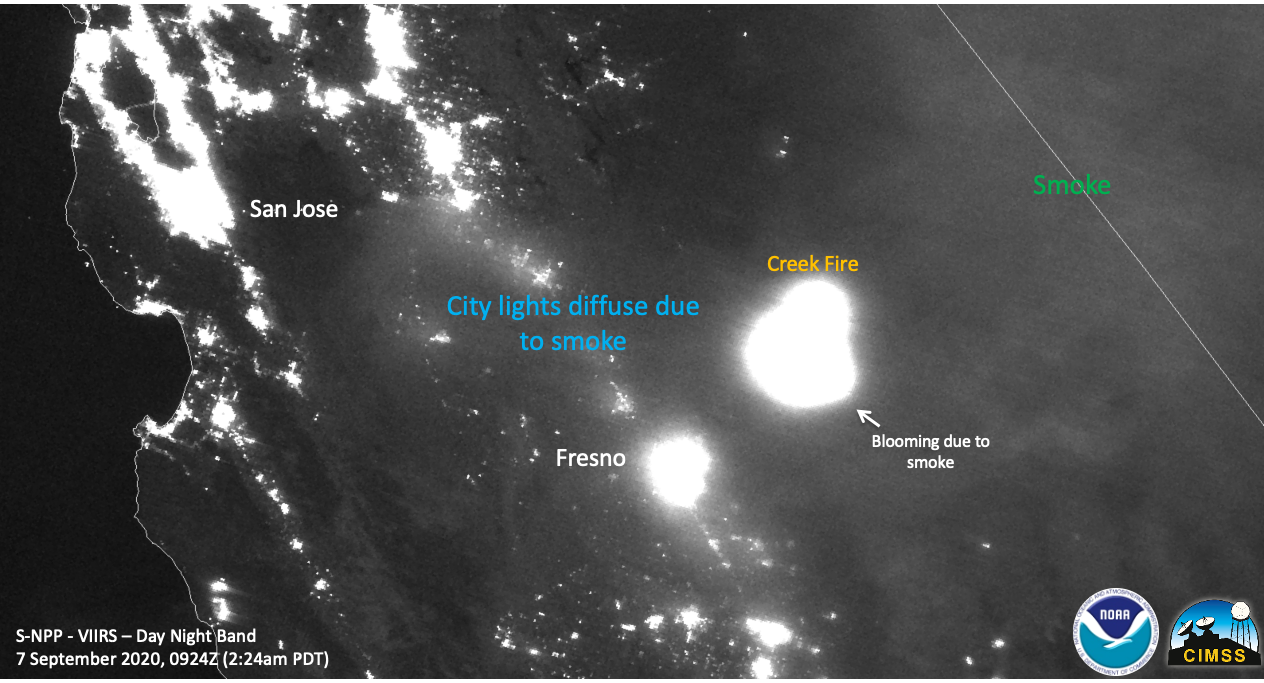
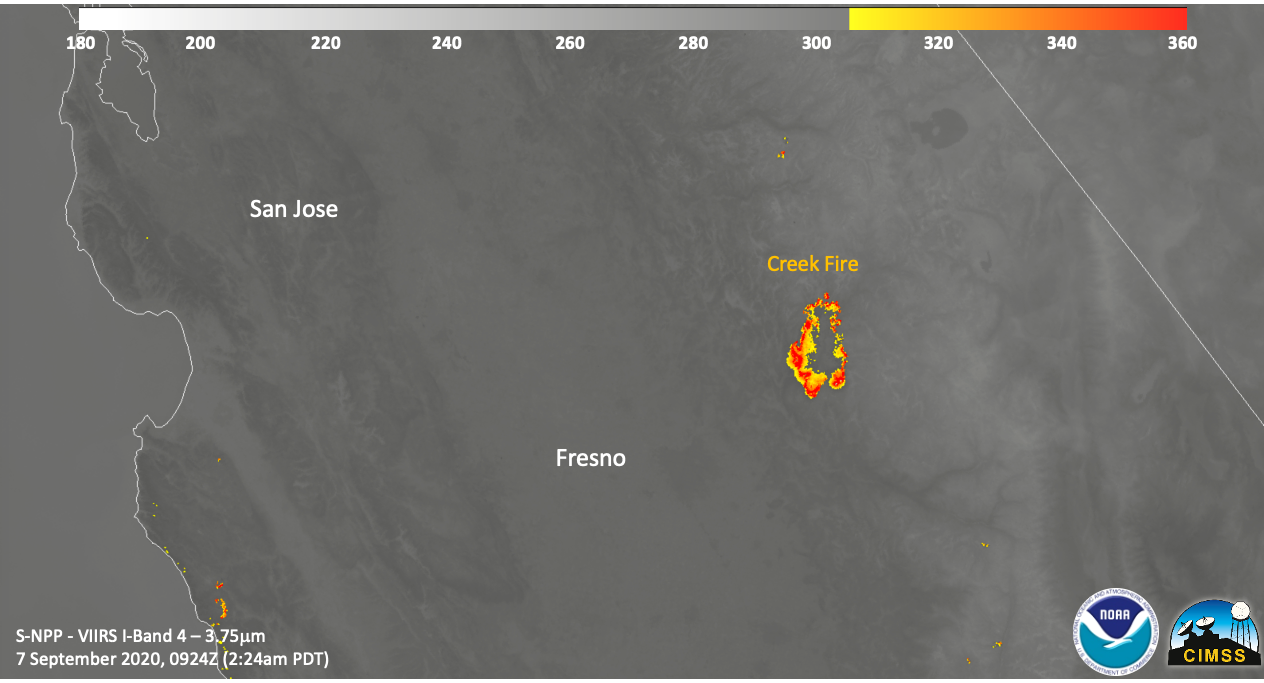
On Friday September 4, 2020 at about 6:44 PM PDT the Creek Fire began in the Big Creek drainage area between Shaver Lake, Big Creek and Huntington Lake, Calif. NASA’s Suomi NPP satellite captured these images of the fire on Sep. 05 through Sep. 07, 2020. From the series of images the spread of the fire can be seen in the outward movement of the red hot spots, although the huge cloud on the 6th obscures all readings due to its size.
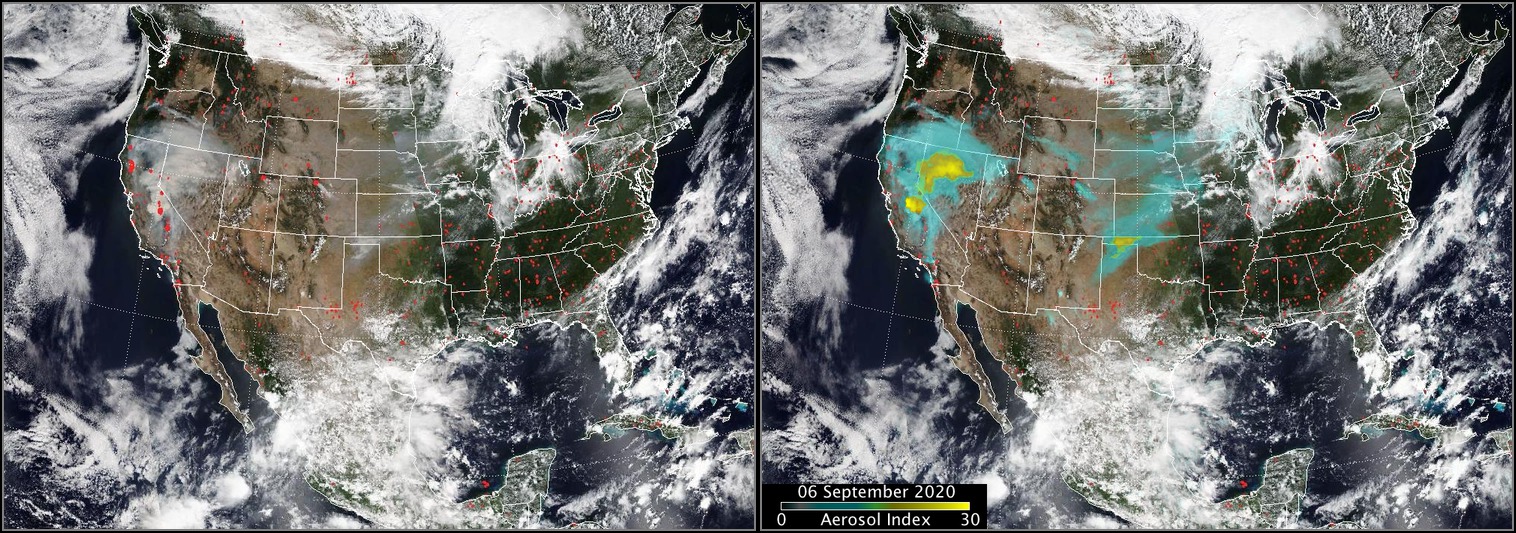
The huge, dense cloud created on Sep. 05 and seen in the Suomi NPP image was a pyrocumulonimbus cloud (pyroCb) and the resulting smoke plume that grew upward was spotted and confirmed on Sep. 06, 2020. A pyrocumulonimbus cloud is also called a cumulonimbus flammagenitus. The origins of the latter word are from the Latin meaning “flame” and “created from.” This perfectly describes a cloud that is caused by a natural source of heat such as a wildfire or volcano. Rising warm air from the fire can carry water vapor up into the atmosphere causing clouds. Any type of convective cloud can be created. In this case, the cumulonimbus, or thunderhead cloud, was created. Precipitation and lightning can also occur with these types of clouds creating a risk that the fire will expand due to increased wind from precipitation downdraft or by creating new fires due to lightning strikes. These are all things that fire managers must keep in mind while continuing to try to fight the fire.
“The pyrocumulonimbus cloud created aerosol index values indicate that this is one of the largest (if not the largest) pyroCb events seen in the United States,” according to Dr. Colin Seftor, Atmospheric Scientist at Goddard Space Flight Center in Greenbelt, Md.
This fast-moving fire is burning in both the Madera and Fresno districts of the Sierra National Forest. The fire began near the communities of Big Creek and Huntington Lake and moved swiftly prompting evacuations. Timber in the area has approximately 80-90 percent tree mortality from the bark beetle providing ample fuel for the fire’s spread.
Inciweb reports that the fire has grown to 135,523 acres as of Sep. 08, 2020. The cause of the fire is still under investigation. Weather concerns continue to plague firefighters as hot and very dry conditions remained over the region through Labor Day with relative humidity very low. Forecasts expect terrain driven winds with overnight temperatures between 70-75 degrees Fahrenheit and daytime temperatures between 90-95 degrees Fahrenheit.
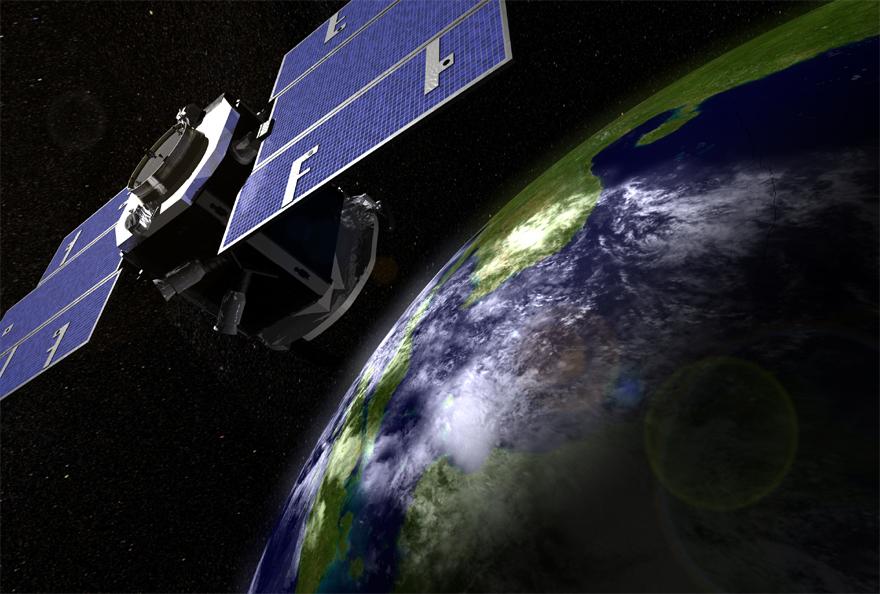
NASA’s satellite instruments are often the first to detect wildfires burning in remote regions, and the locations of new fires are sent directly to land managers worldwide within hours of the satellite overpass. Together, NASA instruments detect actively burning fires, track the transport of smoke from fires, provide information for fire management, and map the extent of changes to ecosystems, based on the extent and severity of burn scars. NASA has a fleet of Earth-observing instruments, many of which contribute to our understanding of fire in the Earth system. Satellites in orbit around the poles provide observations of the entire planet several times per day, whereas satellites in a geostationary orbit provide coarse-resolution imagery of fires, smoke and clouds every five to 15 minutes. For more information visit: https://www.nasa.gov/mission_pages/fires/main/missions/index.html
NASA’s Earth Observing System Data and Information System (EOSDIS) Worldview application provides the capability to interactively browse over 700 global, full-resolution satellite imagery layers and then download the underlying data. Many of the available imagery layers are updated within three hours of observation, essentially showing the entire Earth as it looks “right now.” Actively burning fires, detected by thermal bands, are shown as red points. Image Courtesy: NASA Worldview, Earth Observing System Data and Information System (EOSDIS). Caption: Lynn Jenner with information from Inciweb, Dr. Colin Seftor, and William Straka of the University of Wisconsin-Madison.