Mature and old-growth forests contribute to large-scale conservation targets in the conterminous United States
 Dominick A. DellaSala1*
  Brendan Mackey2
  Patrick Norman2 Carly Campbell2
  Patrick J. Comer3
  Cyril F. Kormos1
  Heather Keith2 Brendan Rogers4
- 1Wild Heritage, A Project of Earth Island Institute, Berkeley, CA, United States
- 2Griffith Climate Action Beacon, Griffith University, Queensland, AU, United States
- 3NatureServe, Boulder, CO, United States
- 4Woodwell Climate Research Center, Falmouth, MA, United States
Mature and old-growth forests (MOG) of the conterminous United States collectively support exceptional levels of biodiversity but have declined substantially from logging and development. National-scale proposals to protect 30 and 50% of all lands and waters are useful in assessing MOG conservation targets given the precarious status of these forests. We present the first coast to coast spatially explicit MOG assessment based on three structural development measures—canopy height, canopy cover, and above-ground living biomass to assess relative maturity. MOG were displayed by major forest types (n = 22), landownerships (federal, state, private, and tribal), and Gap Analysis Project (GAP) management status overlaid on the NatureServe’s Red-listed Ecosystems and species, above-ground living biomass, and drinking water source areas. MOG total ∼67.2 M ha (35.9%) of all forest structural classes and were scattered across 8 regions with most in western regions. All federal lands combined represented the greatest (35%) concentrations of MOG, ∼92% of which is on national forest lands with ∼9% on Bureau of Land Management (BLM) and ∼3% on national park lands (totals do not sum to 100% due to minor mapping errors in the datasets). MOG on national forest lands supported the highest concentration of conservation values. However, national forests and BLM lands did not meet lower bound (30%) targets with only ∼24% of MOG in GAP1,2 (5.9 M ha) protection status. The vast majority (76%, 20.8 M ha) of MOG on federal lands that store 10.64 Gt CO2 (e) are vulnerable to logging (GAP3). If federal MOG are logged over a decade, and half their carbon stock emitted, there would be an estimated 0.5 ppm increase in atmospheric CO2 by 2030, which is equivalent to ∼9% of United States total annual emissions. We recommend upper bound (100%) protection of federal MOG, including elevating the conservation status of Inventoried Roadless Areas. This would avoid substantial CO2 emissions while allowing ongoing carbon sequestration to act as natural climate solutions to aid compliance with the Paris Climate Agreement and presidential executive orders on MOG and 30% of all lands and waters in protection by 2030. On non-federal lands, which have fewer MOG, regulatory improvements and conservation incentives are needed.
Introduction
Forest conservation in the United States has for decades centered on protection and ecological restoration of forests in the later stages of stand structural development because of their irreplaceable biodiversity and ecosystem services (e.g., Davis, 1996; Strittholt et al., 2006). Terms like primary forest, late-successional forest, mature forest, old-growth forest, and ancient forest are routinely used, sometimes interchangeably (Mackey et al., 2014). However, verifiable metrics for national-scale inventory and conservation target setting for these forests are lacking.
Precisely when a forest is considered to be in the later structural development is typically based on several diagnostic features such as the age, height, and diameter-at-breast height (dbh) of the dominant-codominant trees; canopy and understory complexity (vertical and horizontal layering); large standing dead (snags) and down trees (logs); and large trees with broken and highly branched tops. These structural characteristics vary among regions, major forest types, and site conditions (e.g., productive vs. slow growing sites). In particular, gap-phase dynamics, the result of tree death (singular or in cohorts), and blow-down along edges and exposed ridgelines, are important drivers of structural development in later forest development stages. When gaps are formed, the resultant increased light and nutrient levels release suppressed trees to fill the gaps over time (e.g., in the eastern forests, Davis, 1996; Pacific Northwest, Franklin and Van Pelt, 2004; Spies, 2004). The lack of severe stand-level disturbances over extended periods allows trees to acquire impressive stature and old ages associated with increasing biological complexity.
Old-growth forests (the most structurally advanced stage) generally have exceptional levels of biodiversity compared to logged forests (the least structurally advanced) (Luyssaert et al., 2008; Keith et al., 2009; Lindenmayer et al., 2012, 2014; Cannon et al., 2022). However, because of the timber value of older trees they are declining globally (Lindenmayer et al., 2012, 2014; Mackey et al., 2014). The loss of old-growth forests is coupled with changes to the global climate (Lawrence et al., 2022), reducing opportunities for natural climate solutions (Griscom et al., 2017; Moomaw et al., 2019). In the United States, conservation importance of old-growth forests has been recognized in every forested region, including Alaska (DellaSala, 2011; Orians and Schoen, 2012; Vynne et al., 2021; DellaSala et al., 2022), Pacific Northwest (Strittholt et al., 2006; Krankina et al., 2014), West (Rockies, Pacific Southwest, Southwest collectively: Kauffman et al., 1992, 2007), Central (Shifley et al., 1995), Great Lakes (Alverson et al., 1994; Carleton, 2003), Southeast (Hanberry et al., 2018), and Northeast (Davis, 1996; Leak and Yamasaki, 2012; Ducey et al., 2013).
Old-growth forest importance can also be described along a spatial gradient from individual trees within a stand to their context within watersheds and landscapes. At the tree level, the largest trees in old-growth forests may represent just 1% of all stems yet store at least 40% of the above-ground carbon as carbon stock increases with tree size as trees age (Stephenson et al., 2014; Lutz et al., 2018; Mildrexler et al., 2020). At the stand level, old-growth forests store 35 to 70% more carbon, including in the soils, compared to logged stands (Keith et al., 2009; Mackey et al., 2014; Mayer et al., 2020). Old-growth forest stands may also act as a natural buffer against extreme climate conditions (De Frenne et al., 2013; DellaSala et al., 2015; Frey et al., 2016; Betts et al., 2017). At the watershed level, old-growth forests maintain hydrological cycles (Perry and Jones, 2016; Crampe et al., 2021). In the Pacific Northwest, old-growth forests may function as fire refugia in large wildfire complexes (Lesmeister et al., 2021).
Aside from select portions of the West, most old-growth forests in the conterminous United States were eliminated decades-centuries ago as logging and development proceeded from east to west coast. What remains is largely on federal lands where the government has untapped policy options for stepped-up conservation. Some of the remaining old-growth forests on national forest land are within Inventoried Roadless Areas (IRAs) that are at least 2,000 ha. Road building and most forms of logging are prohibited within IRAs but only administratively and not by an act of Congress, meaning protections are not inviolate or permanent (i.e., classified as GAP3 multiple use management). Importantly, significant portions of eastern forests are approaching maturity (100 + years, Gunn et al., 2013). As mature forests with advanced structure recover from historical logging, they could develop old-growth characteristics within just a few decades.
Primary and old-growth forests generally have received increased attention internationally as natural climate solutions (DellaSala et al., 2020; IUCN, 2020; Law et al., 2021), including from policy makers1 (e.g., March 22, 2022) and conservation non-governmental organizations (NGOs) in the United States2,3; (accessed May 15, 2022). Article 5.1 of the Paris Climate Agreement calls on governments to protect and enhance “carbon sinks and reservoirs,” while Article 21 of the UNFCCC COP26 Glasgow Climate Pact emphasizes “the importance of protecting, conserving and restoring nature and ecosystems, including forests… to achieve the long-term global goal of the Convention by acting as sinks and reservoirs of greenhouse gases and protecting biodiversity…” (UNFCCC, 2021). Furthermore, the United States was one of 140 nations at COP26 that pledged to end forest degradation and deforestation by 2030 (United Nations Climate Change, 2021). Also, the Summary for Policy Makers (SPM.D.4) in the Intergovernmental Panel on Climate Change [IPCC] (2022) report mentions safeguarding biodiversity and ecosystem integrity as fundamental to climate resilient developments. Attention to mature and old-growth forests can inform implementation of these policy commitments.
Large-scale conservation proposals for all land and waters have increasingly relied on 30 percent (i.e., 30% protected by 2030 or 30 × 30; Dinerstein et al., 2019; Carroll and Noss, 2021; Carroll and Ray, 2021; Law et al., 2021, 2022; One Earth Global Safety Net4; accessed May 28, 2022) and 50 percent (Half Earth) protection targets that involve triage approaches (Noss et al., 2012; Wilson, 2016). Large-scale target setting also has policy relevance, as exemplified by President Joe Biden’s January 2021 executive order directing federal agencies to develop 30 × 30 targets for all lands and waters in the United States (White House, 2021). An April 2022 executive order from the President also directed federal agencies to inventory and assess threats to both mature and old-growth forests nationwide for possible protections (White House, 2022). Moreover, regionally specific proposals, such as the 79M ha of proposed protected areas in a five state area (OR, WA, ID, MT, and WY; Bader, 2000), a portion of which includes congressionally proposed wilderness additions in the Northern Rockies Ecosystem Protection Act (S.1276), have not assessed the amount of mature and old-growth forests nor its management status (i.e., how much protection is needed?). In all cases, it is vital that these forests are clearly defined, assessed, and mapped at multiple spatial scales (regional to national) to advise decision makers and NGOs on how best to meet climate and biodiversity policies and conservation targets.
Our objectives are to examine the contribution of mature and old-growth forests in the conterminous United States to: (1) conservation of at-risk forest ecosystems and species based on IUCN Red List criteria (Comer et al., 2022); (2) source catchments for drinking water (Mack et al., 2022); and (3) above-ground living biomass (Harris et al., 2021). We also applied conservation target setting developed for continental scale assessments to determine the contribution these forests could make to 30% (i.e., 30 × 30, Dinerstein et al., 2019) (lower bound), 50% (i.e., Half Earth; Noss et al., 2012; Wilson, 2016) (mid bound), and 100% (upper bound) protections. For our study, we are using estimates of forest structure that correlate with stand development collectively referred to as mature-old growth forests (MOG) to capture both the mature stage that is approaching old growth condition and the most advanced old growth stage as well. We also consider old growth a subset of primary forest defined as any forest stage lacking commercial logging or other industrial-scale developments that impairs ecosystem functions (Mackey et al., 2014). To our knowledge, this is the first comprehensive and spatially explicit assessment of MOG in the conterminous United States.
Materials and methods
Forest structure mapping
We mapped the relative level of forest structural maturity using three published spatial data sets that include forest canopy cover, canopy height, and above-ground living biomass derived from modeled satellite data (Table 1). These data were stratified by United States Ecoregions Level III (n = 28) (Omernik and Griffith, 2014) and Forest Types Groups (n = 85) (Ruefenacht et al., 2008) to account for the influences of variation in life history traits governing tree longevity and local environmental conditions on plant growth and ecosystem processes, as well as differing human and natural disturbance regimes. We used field measurements of canopy height and biomass from the Forest Inventory and Analysis plot database (FIA, 2022) to compare with our modeled forest maturity map and to aid in the interpretation of the map. We used a time series of available spatial data to examine the extent to which forests that were mapped as relatively less structurally advanced coincided with the footprints of severe natural disturbances. Further details on the methodology are provided in the Supplementary.
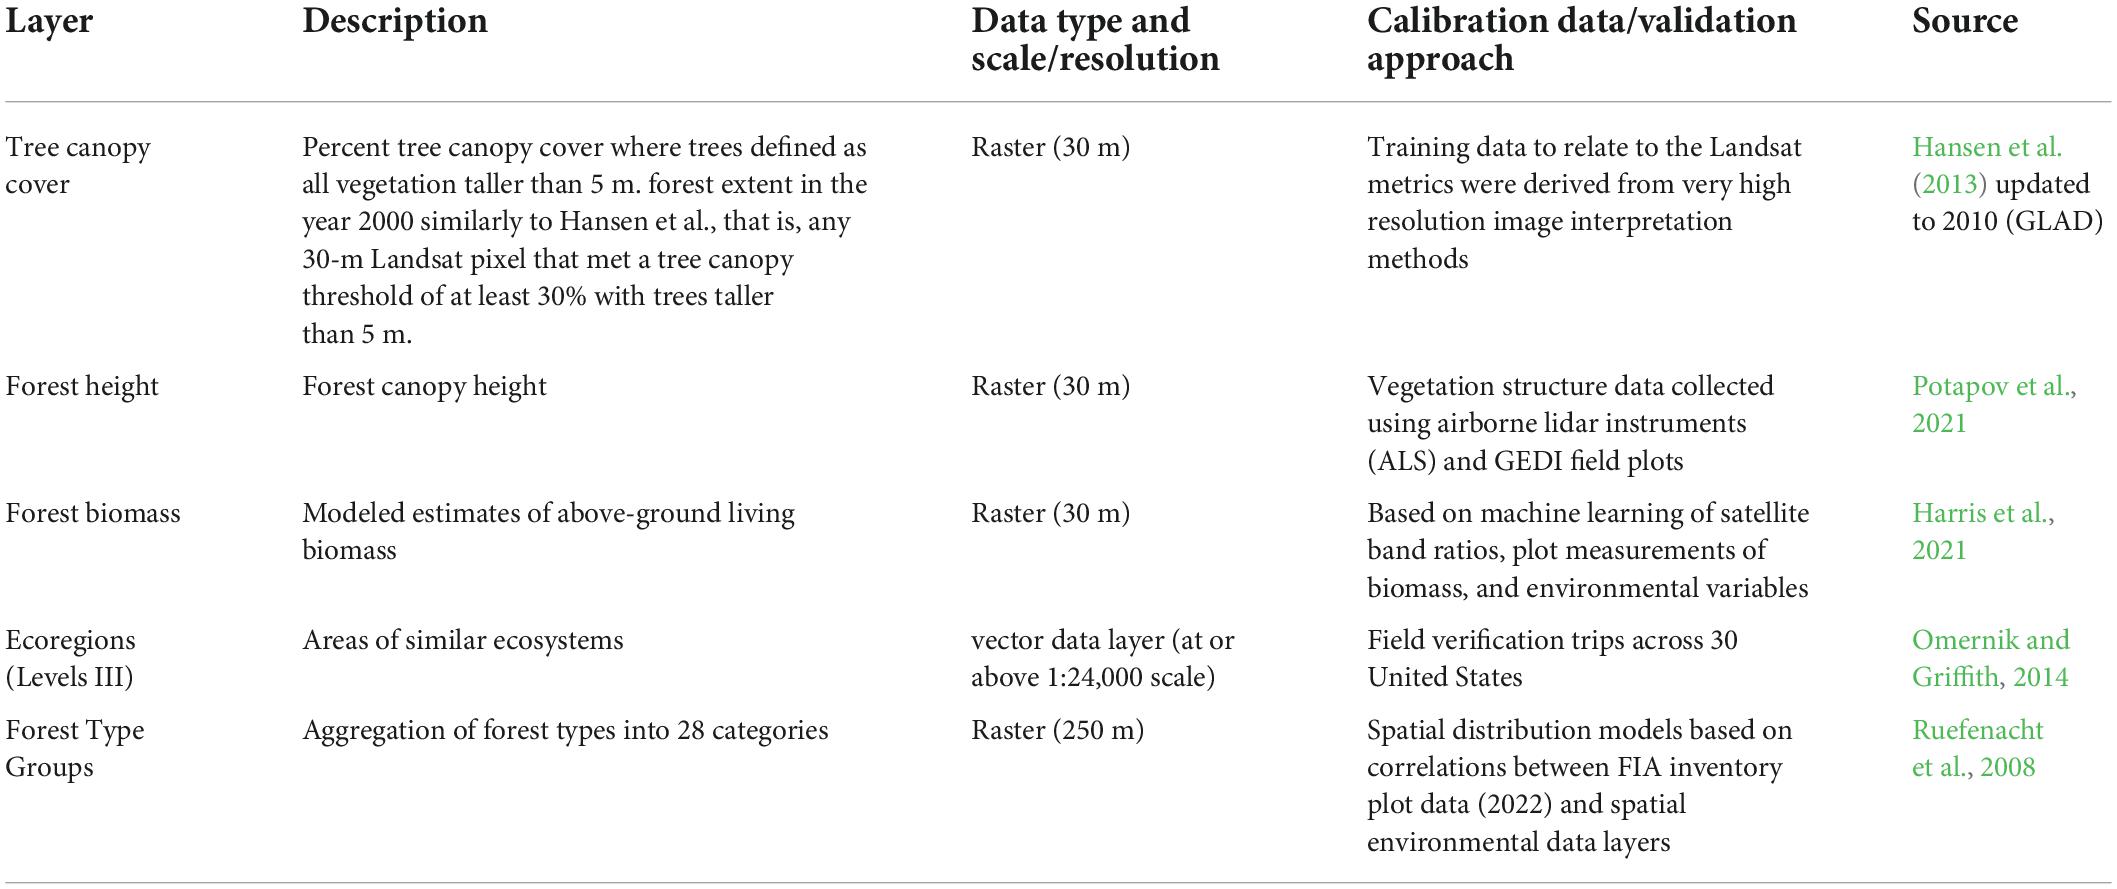
Table 1. Details for the spatial data layers used in the forest maturity modeling and the attribution and validation analyses.
Expert workshops
A series of regional zoom workshops were conducted from September to November 2021 to consult with ecological and forest conservation experts (Supplementary). In total, 40 experts attended with each workshop focused on a major forested region within their region of interest. Key workshop objectives are listed in the Supplementary, including using participants to provide feedback on the initial modeling results for fine tuning. Expert consensus was that the appropriate level of forest ecosystem classification was the 28 Forest Types Groups—which comprise aggregations of more finely defined forest types—spatially modeled from FIA inventory plot data at a 250-m pixel resolution (Ruefenacht et al., 2008) and for Level III ecoregions (Omernik and Griffith, 2014).
Spatial analysis
The three spatial structural data layers of forest cover, canopy height, and above-ground living biomass were made available for the conterminous United States (Table 1). Spatial analyses were undertaken using Google Earth Engine (Gorelick et al., 2017). As the three data layers were generated using the Global Land Analysis and Discovery’s (GLAD) Landsat Analysis Ready Data (ARD), they shared the same 30-m pixel resolution.
An overview of the workflow to create a seamless conterminous-United States wide spatial data layer of relative forest maturity is provided in Figure 1. This included creating a spatial vector file of each Forest Type Group for each Level III Ecoregion. Spatial data layers were generated based on spatial coverage for the Forest Type Groups found in each Level III Ecoregion, resulting in a total of 782 unique combinations. For each pixel, we quantified quartile values for the three structural variables (canopy cover, canopy height, and biomass) within each of the 782 combinations. A score was then calculated for each pixel as follows: (a) the lowest quartile value for each metric was given a score of 0 and the highest a score of 3; then (b) the three metric scores were summed giving a range in possible values from 0 (lowest quartile for the three variables) to 9 (highest quartile for the three variables), representing 10 ordinal forest maturity classes. Based on expert feedback, we then produced a simplified structural class map by classifying pixels with a score of 0 as “indeterminant, those with scores of 1–3 as “Young,” scores 4–6 “Intermediate” and scores of 7–9 as “Mature.” Using a global spatial data set (Petersen et al., 2016), we analyzed the modeled forest maturity map to identify how much of each maturity class was plantation rather than naturally regenerating forest and excluded plantations from analysis.
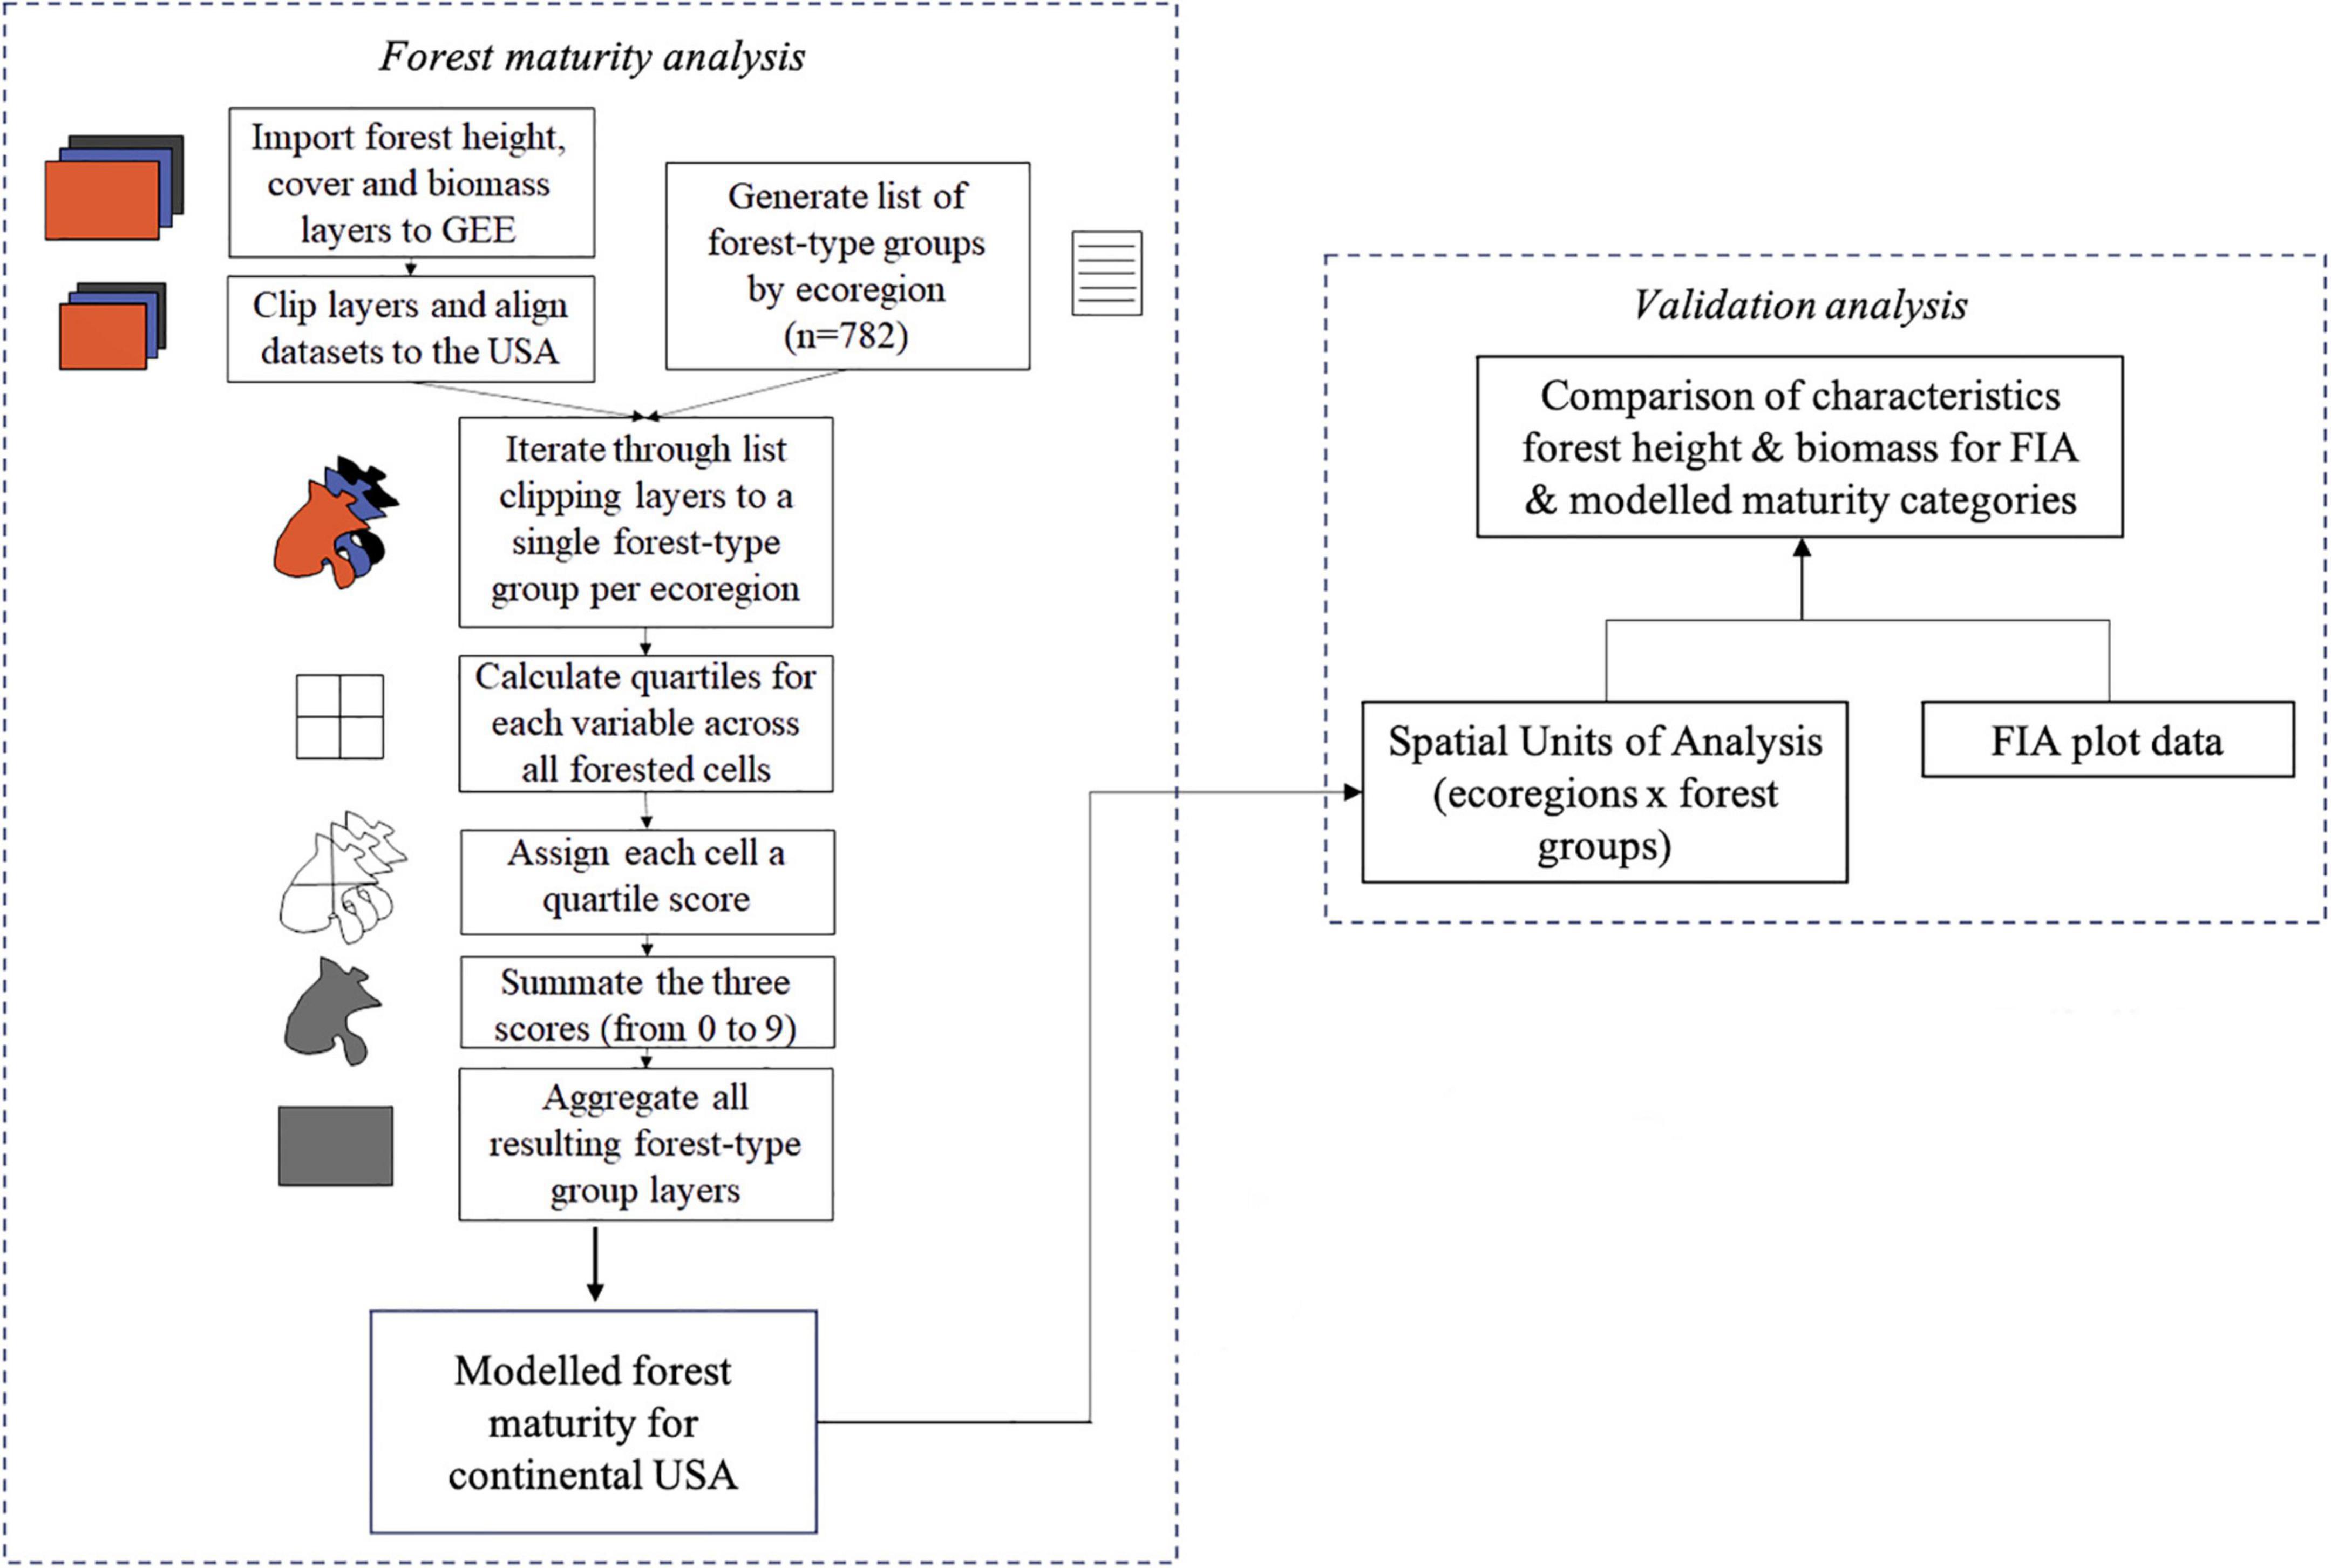
Figure 1. Workflow showing main steps in the calculation of the forest maturity structure model for conterminous United States, along with the validation analysis. The three 30-m resolution spatial data sets for forest cover, canopy height, and biomass were analyzed within 872 spatial units of analysis (SUA) defined by the intersection of ecoregions and major forest types. Forest Inventory Analysis (FIA, 2022) plot data were used for a validation analysis. Further details in Supplementary Information—Methods.
Calibration analysis
We used FIA plot data as an independent data source for calibration off the modeled forest maturity structure map. Of the three variables, only canopy height could be used for validation as the input biomass layer used FIA biomass data. The spatial units of analysis (SUA) for comparison with the FIA plot data were generated from the intersection of the map of 85 United States Ecoregion Level III with the maps of the 28 Forest Type Groups. Those SUAs were analyzed for which there were at least 10 FIA plots for each of the three FIA Structural Stage Classification levels (Pole, Mature, Late) (n = 41). For each of these 41 SUAs, we calculated aggregate statistics from the quartiles and median values for canopy height and biomass from a random sample of pixels within each of the three modeled structure levels (Young, Intermediate, MOG) with 1.5–5% of pixels sampled. Further details are provided in the Supplementary.
Land ownership and gap analysis project status
The extent and management status of MOG was assessed using spatial data provided by government agencies. We used the forest ownership dataset produced by Sass et al. (2020) for the USDA Forest Service based on 2017 data. Each ownership category was used as a mask to determine the extent of MOG within different tenures across the conterminous United States. The only additional aggregation made was the combination of the two FIA 41 categories, TIMO/REIT and private that were combined into a single masking layer. The Gap Analysis Project (GAP) management status codes (GAP1–4) was applied to MOG using the PAD-US Spatial Analysis Data provided by U.S. Geological Survey [USGS], and Gap Analysis Project [GAP] (2020). GAP 1 (e.g., Wilderness, National Parks) and GAP2 (e.g., National Monuments) were considered protected lands. GAP3 was multiple use management and GAP4 was no protection. The flattened version of the dataset was an important component of the analysis for determining the protected status of MOG. Inventoried roadless areas (IRAs) were filtered from the dataset and classified in our study as GAP2.5—that is—even though IRAs are given GAP3 status in the PAD-US dataset, we gave some credit to IRAs for administrative protections from most forms of logging. To ensure consistency among datasets, we compared the IRA layer to the 2001 Roadless Rule Feature layer provided by the USDA5 for cross validation. We also assessed additional ownership and management of MOG including National Forests (National Forest System Land Units6), National Parks7 and BLM (Derived from PAD-US8). The metadata9 for landownerships did create some minor overlap problems where IRAs were inadvertently present in the dataset as within other ownerships even though this designation applies only to national forests. Those are recognized in each of the applicable tables as IRA misclassifications. The five western state regional example (79 M ha) that includes the Northern Rockies Ecosystem Protection Act was mapped after Bader (2000).
Biomass calculation
To determine the estimated amount of above-ground living biomass stored within MOG, spatial data produced by Harris et al. (2021) was used as an input layer. Calculating the amount of biomass involved firstly warping the dataset to ensure a 30-m pixel size using GDAL and later masking to the extent of determined mature forest. The R program exactextractr was then utilized to sum the total amount of biomass within the forests. Due to the discrepancy between the input data being at a 30-m resolution and scaled to Mg/ha, the total value was then converted to produce overall biomass weight in tons.
At risk forest ecosystems and species
The IUCN Red List of Ecosystems (RLE) is an emerging global standard that integrates data and knowledge to document the relative risk status of ecosystem types. RLE criteria were used to assess 655 terrestrial ecosystems in temperate and tropical North America, including 182 forest and woodland ecosystem types in the conterminous United States using the U.S. National Vegetation Classification (Comer et al., 2022). We mapped these ecosystem types nationally using inter-agency LANDFIRE (2016) map products at 30-m pixel resolution with remote sensing data from approximately 2011. The RLE indicators that gauge the probability of range wide ecosystem collapse were measured for each criterion to address: trends in ecosystem extent (A); relative restricted nature of its distribution (B); extent and relative severity of environmental degradation (C); and extent and relative severity of disruption of biotic processes (D). Based on these measures, we categorized ecosystems as Collapsed, Critically Endangered, Endangered, Vulnerable, Near Threatened, Least Concern, Data Deficient, or Not Evaluated. Some 119 (65%) of the 182 United States forest ecosystem types were listed as threatened in some form (i.e., either Critically Endangered (CR) [6.5%], Endangered (EN) [24%], Vulnerable (VU) [24%], or Near Threatened (NT) [10%]).
We also overlaid our MOG map with the modeled distributions of the threatened forest and woodland types to quantify their relative representation within managed and protected lands.
At-risk forest-associated species
We used a database containing an analysis of the habitat requirements for species of conservation concern, including their co-occurrence with standard ecosystem classification units and vegetation structural attributes (Reid et al., 2016). This database includes over 6,000 plant and animal taxa known to occur throughout the conterminous United States. At-risk status was provided using both NatureServe conservation status ranks (Stein et al., 2000) and for listing status under the United States Endangered Species Act (i.e., for species listed as Threatened or Endangered, as well as Candidate or Proposed). We documented relationships through map overlays of species locations with mapped ecosystem type distributions. While incomplete, mapped distributions of forest types provide an initial indication of where MOG may support at-risk forest-associated species.
Drinking water source areas
The USDA Forest to Faucets assessment provides a relative index summarizing the importance of forested land for the provision of surface drinking water based on biophysical and demographic data (Mack et al., 2022). These data were available at the scale of subwatersheds delineated by the USGS, of which there were approximately 100,000 in the United States (USGS et al., 2013). We masked these data by the MOG pixels to provide a spatial layer showing the relative importance of MOG to surface drinking water. We also calculated MOG area for four classes representing each quartile of the relative importance to surface drinking water index and summarized by area for each GAP status and land tenure. Classes ranged from 1 (lowest importance, 0–25% relative importance) to 4 (highest importance, 76–100% relative importance) based on the relative importance to surface water index defined by the USDA Forest Service.
Results
Forest structure classes
Three categories of structural development were identified based on the ten ordinal i.e., ranked categorical classes: young—or least advanced structurally (scores of 1–3)—totaled 41.4 M ha (22.1%); intermediate (scores of 4–6) totaled 78.5 M ha (42.0%); and MOG –most advanced structurally (scores of 7–9)—totaled 67.2 M ha (35.9%) with a grand total of 187.0 M ha of mapped structural classes (Supplementary Figure 1). The percentage area of young, intermediate, and MOG within United States Ecoregions Level II is also detailed in Supplementary Figure 2. The comparisons of FIA plot based estimates of biomass, canopy height and relative structural maturity are provided in Supplementary Figure 3 for the 41 spatial units of analysis were there were sufficient plot data.
Mature and old-growth forests spatial extent
The spatial distribution of MOG within the conterminous United States is shown at a national scale (Figure 2) and with a zoom-in to eight forested regions where these forests are widely scattered, including the Pacific Northwest (1), Pacific Southwest (2), Rockies (3), Southwest (4), Great Lakes (5), South Central (6), Northeast (7), and Southeast (8) (Figure 3).
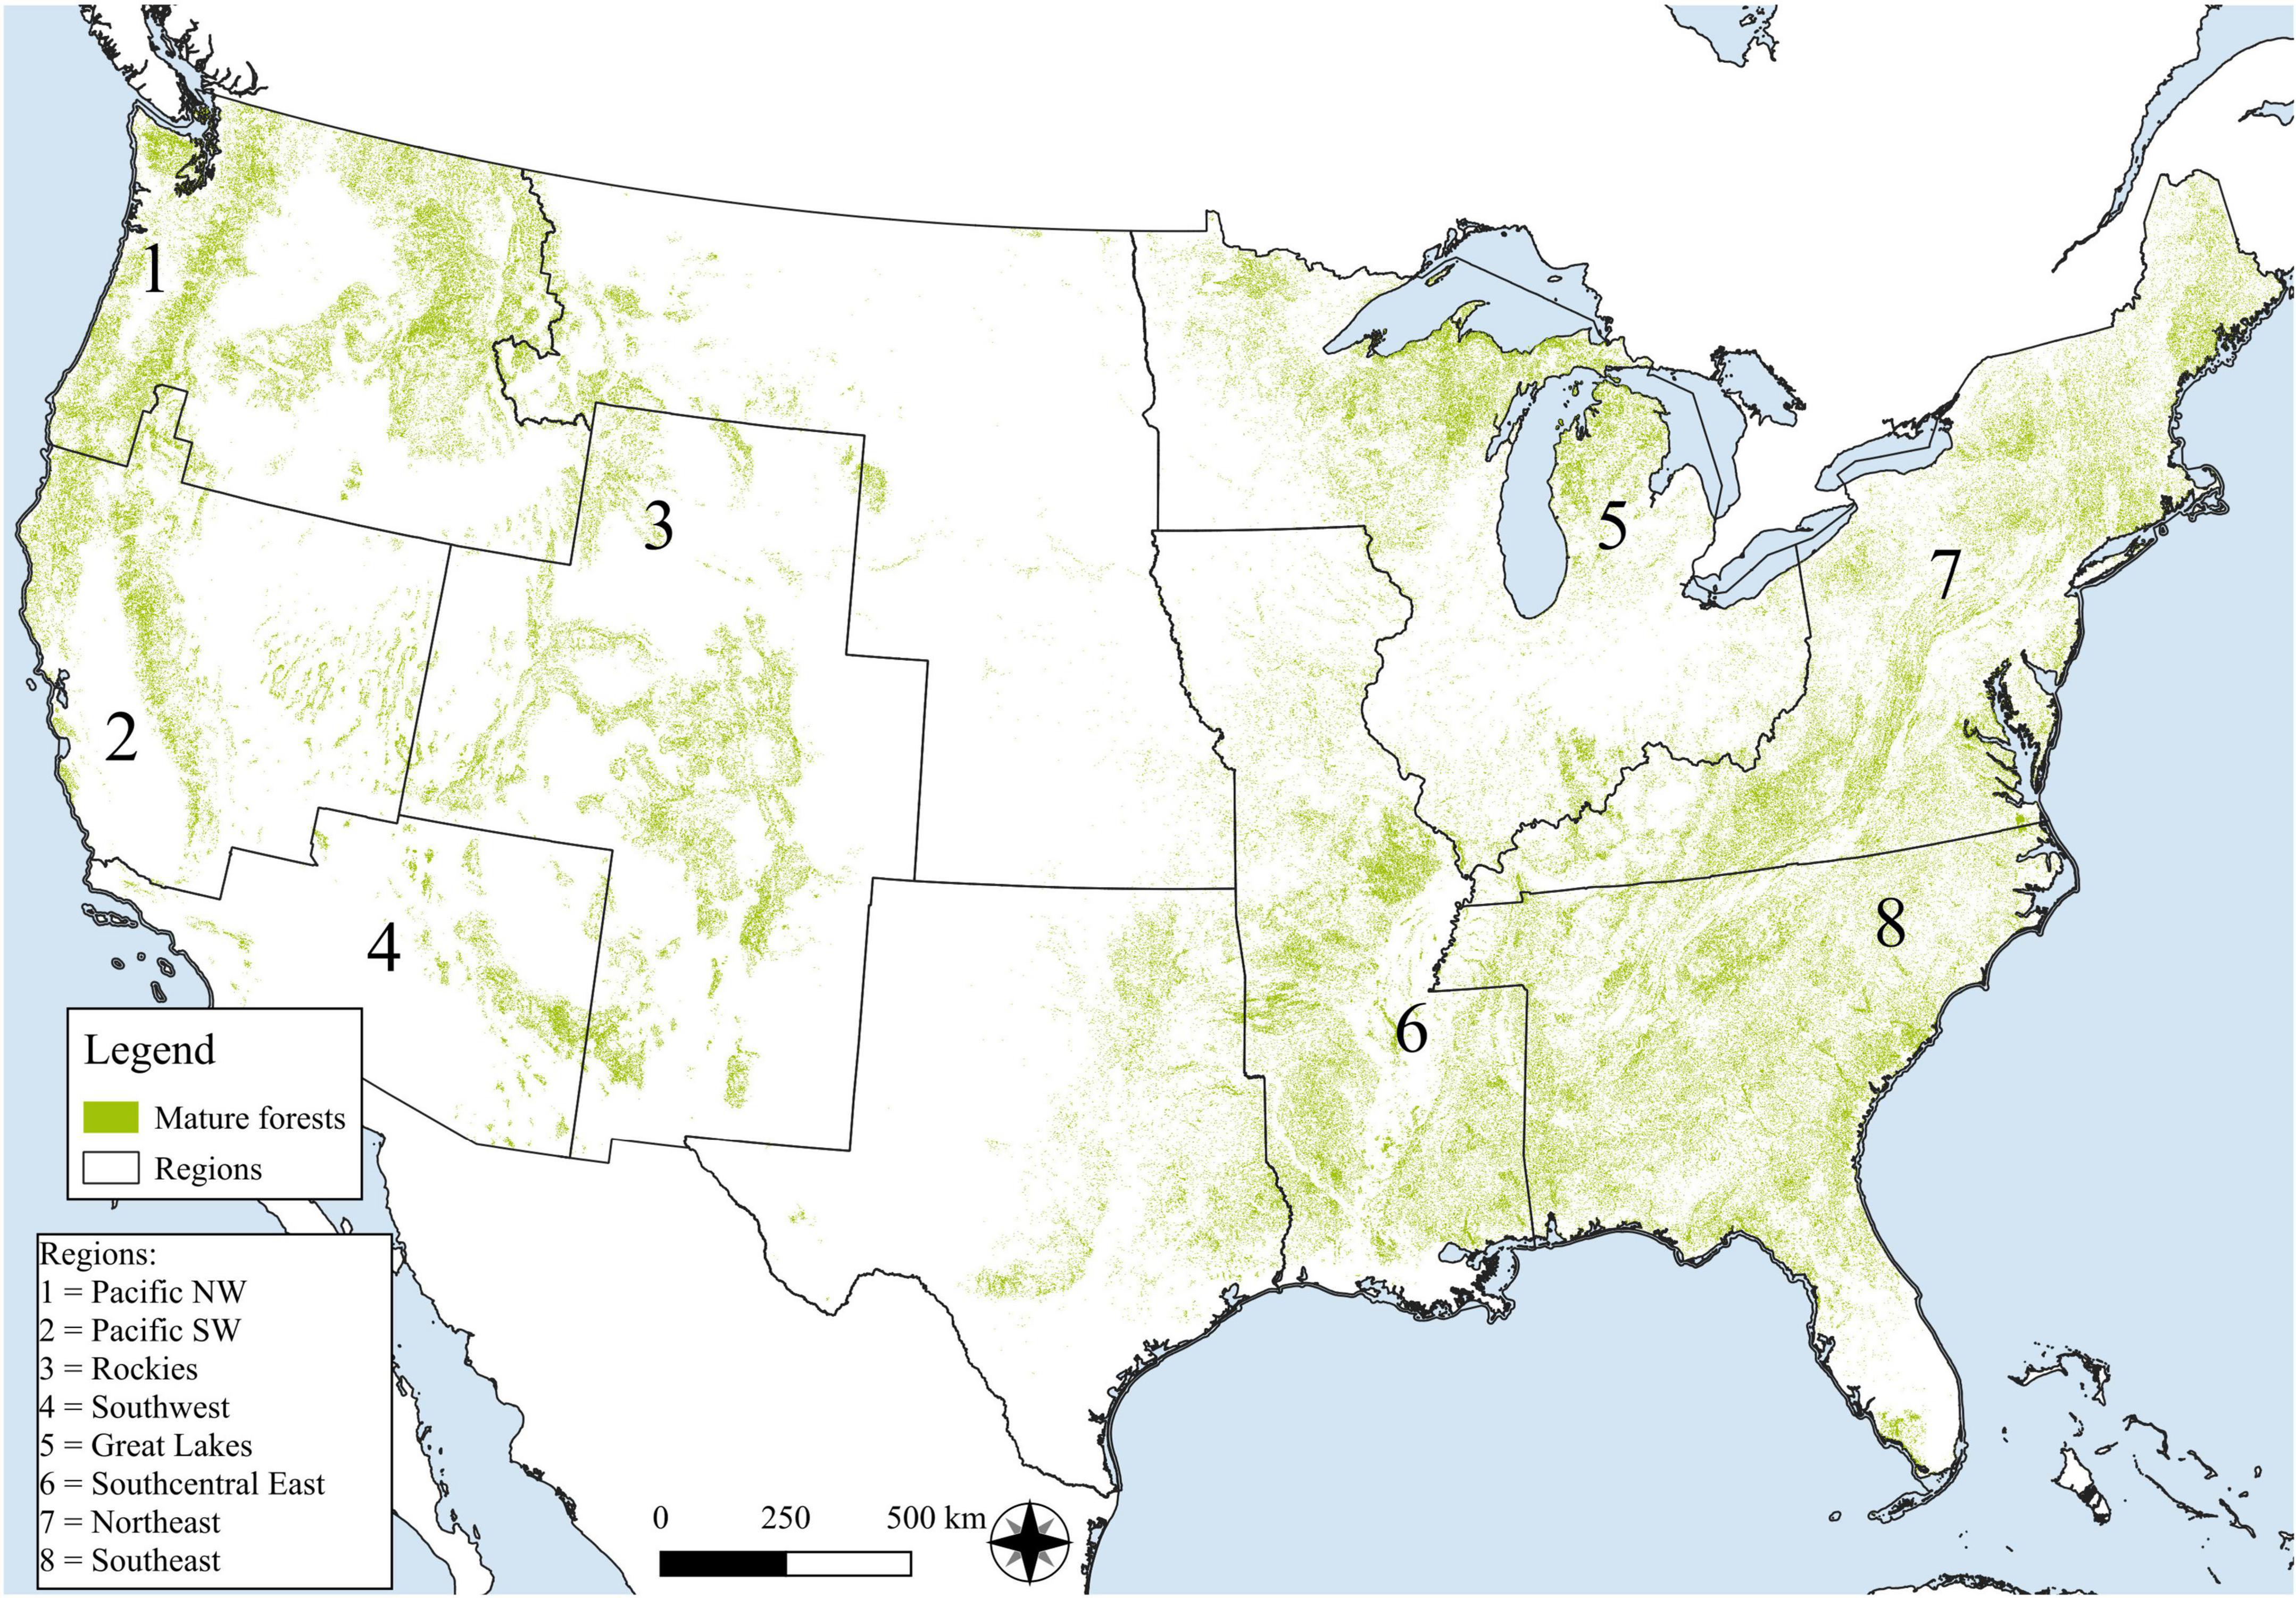
Figure 2. Distribution of modeled mature and old-growth forests (MOG) for the conterminous United States. Forest regions with MOG are numbered.
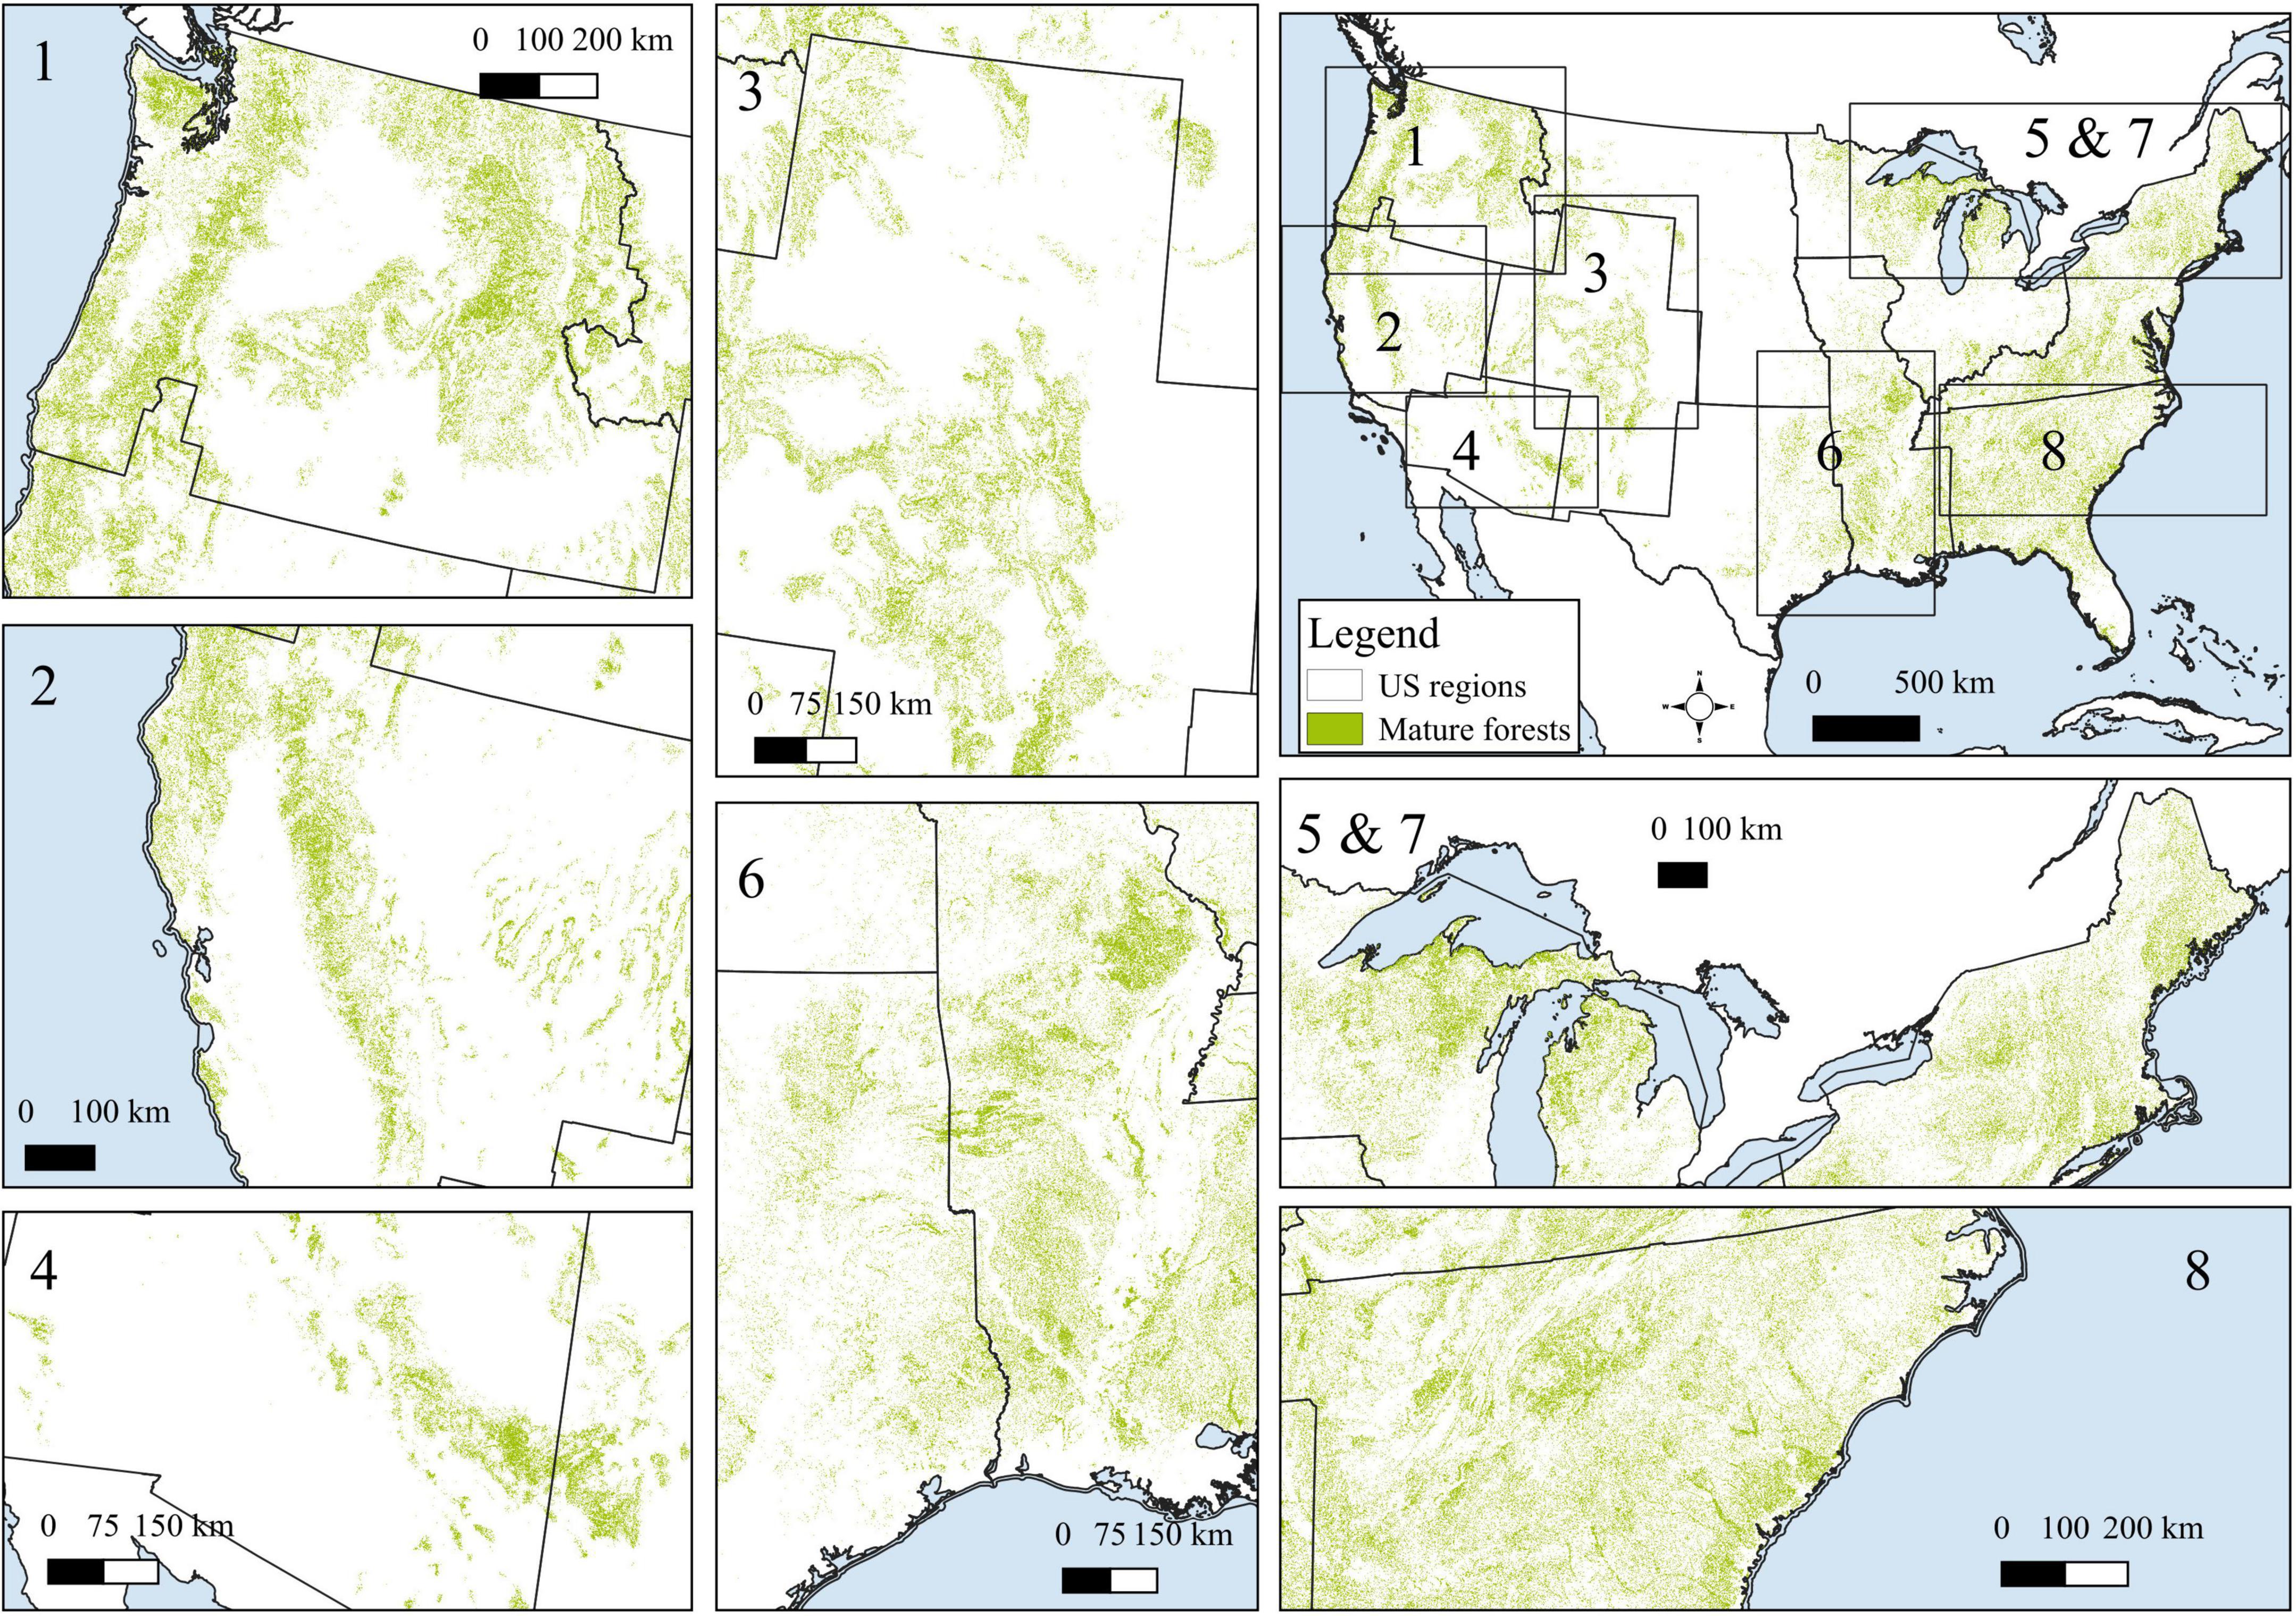
Figure 3. Regional zoom-ins of mature and old-growth forests of the conterminous United States. Panels show Pacific Northwest (1), Pacific Southwest (2), Rockies (3), Southwest (4), Great Lakes (5), South Central (6), Northeast (7), and Southeast (8).
Example photographs of general MOG structural features for major forest types of the conterminous United States illustrate anticipated variability in structural development of these forests (Figures 4A–F).
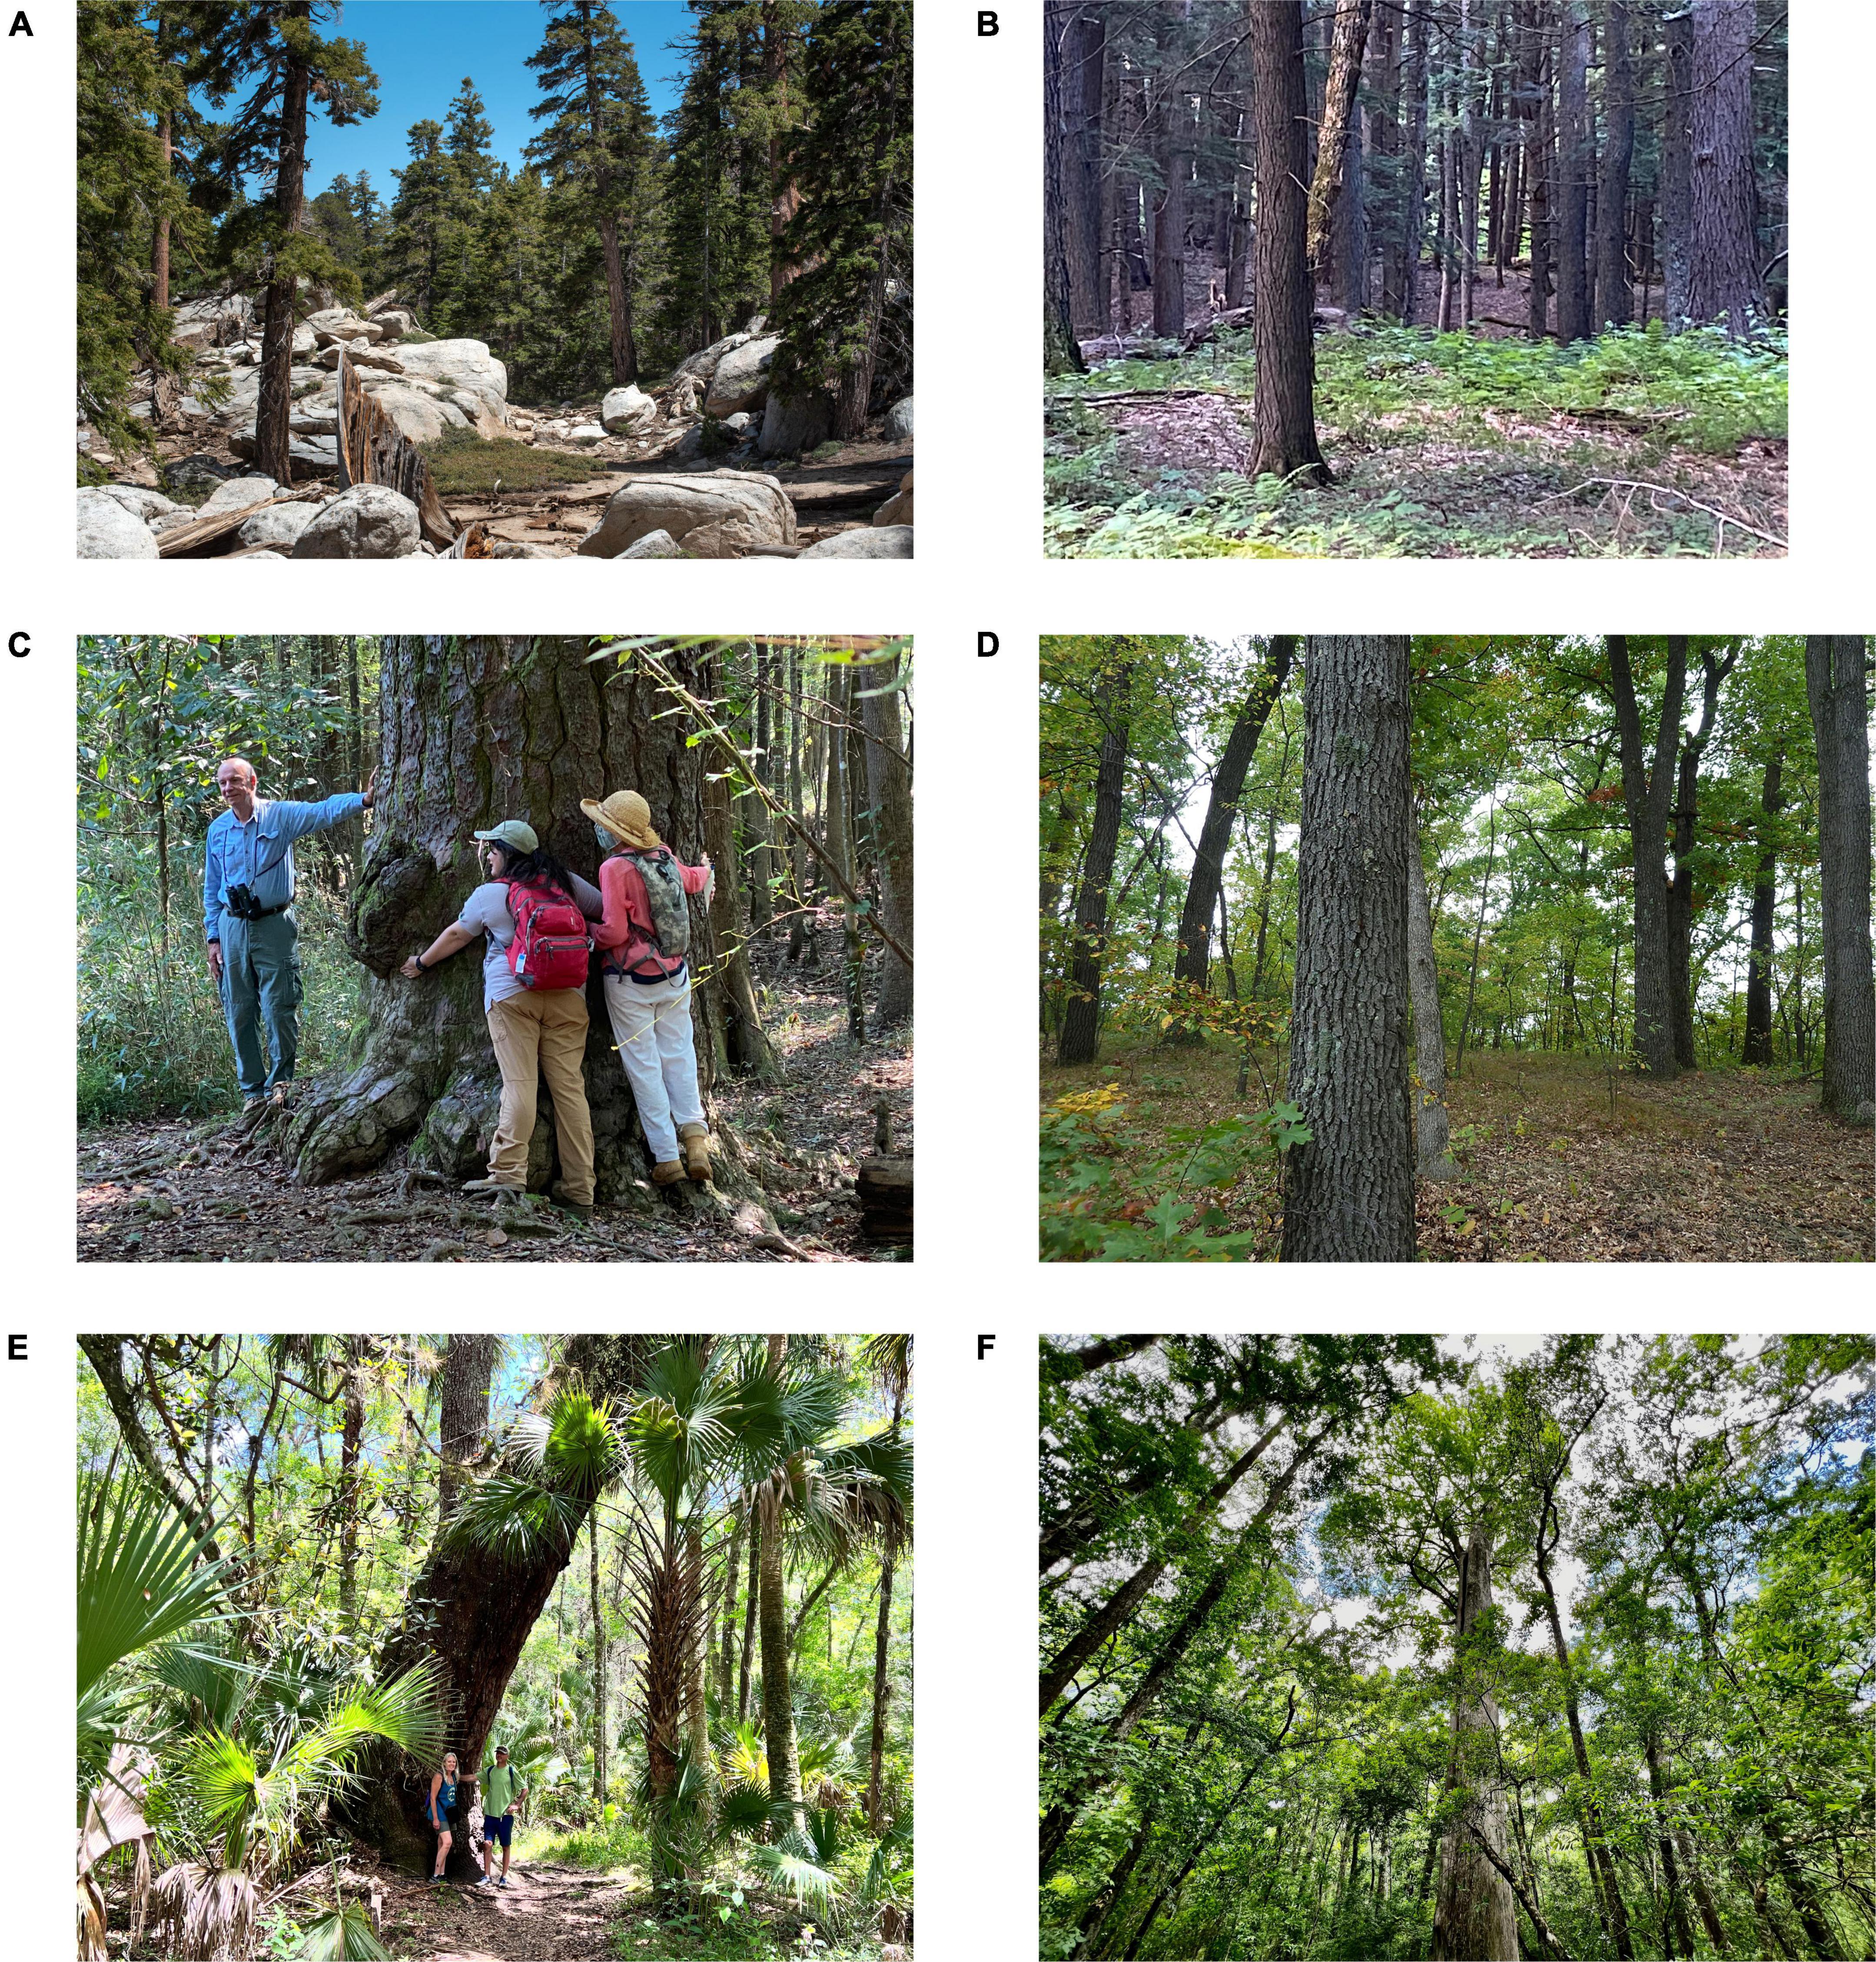
Figure 4. Examplary photographs of mature and old-growth forests in the United States. (A) Mixed-conifer forest, Sequoia National Park, CA, United States (B. Bryant). (B) Mature Eastern Hemlock (Tsuga canadensis) stand, Huron Mountain Club Upper Peninsula, MI, United States (B. Boucher). (C) Bottomland hardwood forest, Congaree National Park, SC, United States (J. Maloff, Old Growth Network). (D) North-Central Interior Dry-Mesic Oak Forest and Woodland (B.S. Slaughter). (E) Hardwood hammock forest, Starkey Park, FL, United States (D. DellaSala). (F) Top ten largest bald cypress (Taxodium distichum) in Florida, Upper Pithlachascotee River Preserve (D. DellaSala). Nearly all old growth cypress was logged in the 1930s.
Using the western states regional MOG assessment example, MOG represent ∼7.60 M ha (9.6%) of the 79.1 M ha within the five-state area that includes the Northern Rockies Ecosystem Protection Act under consideration in the United States Congress (Figure 5). Only 20% of MOG are in GAP1 and 2 status with 30% in IRAs having intermediate protections (GAP 2.5) (Table 2), meaning the vast majority of MOG in this proposal is vulnerable to development pressures.
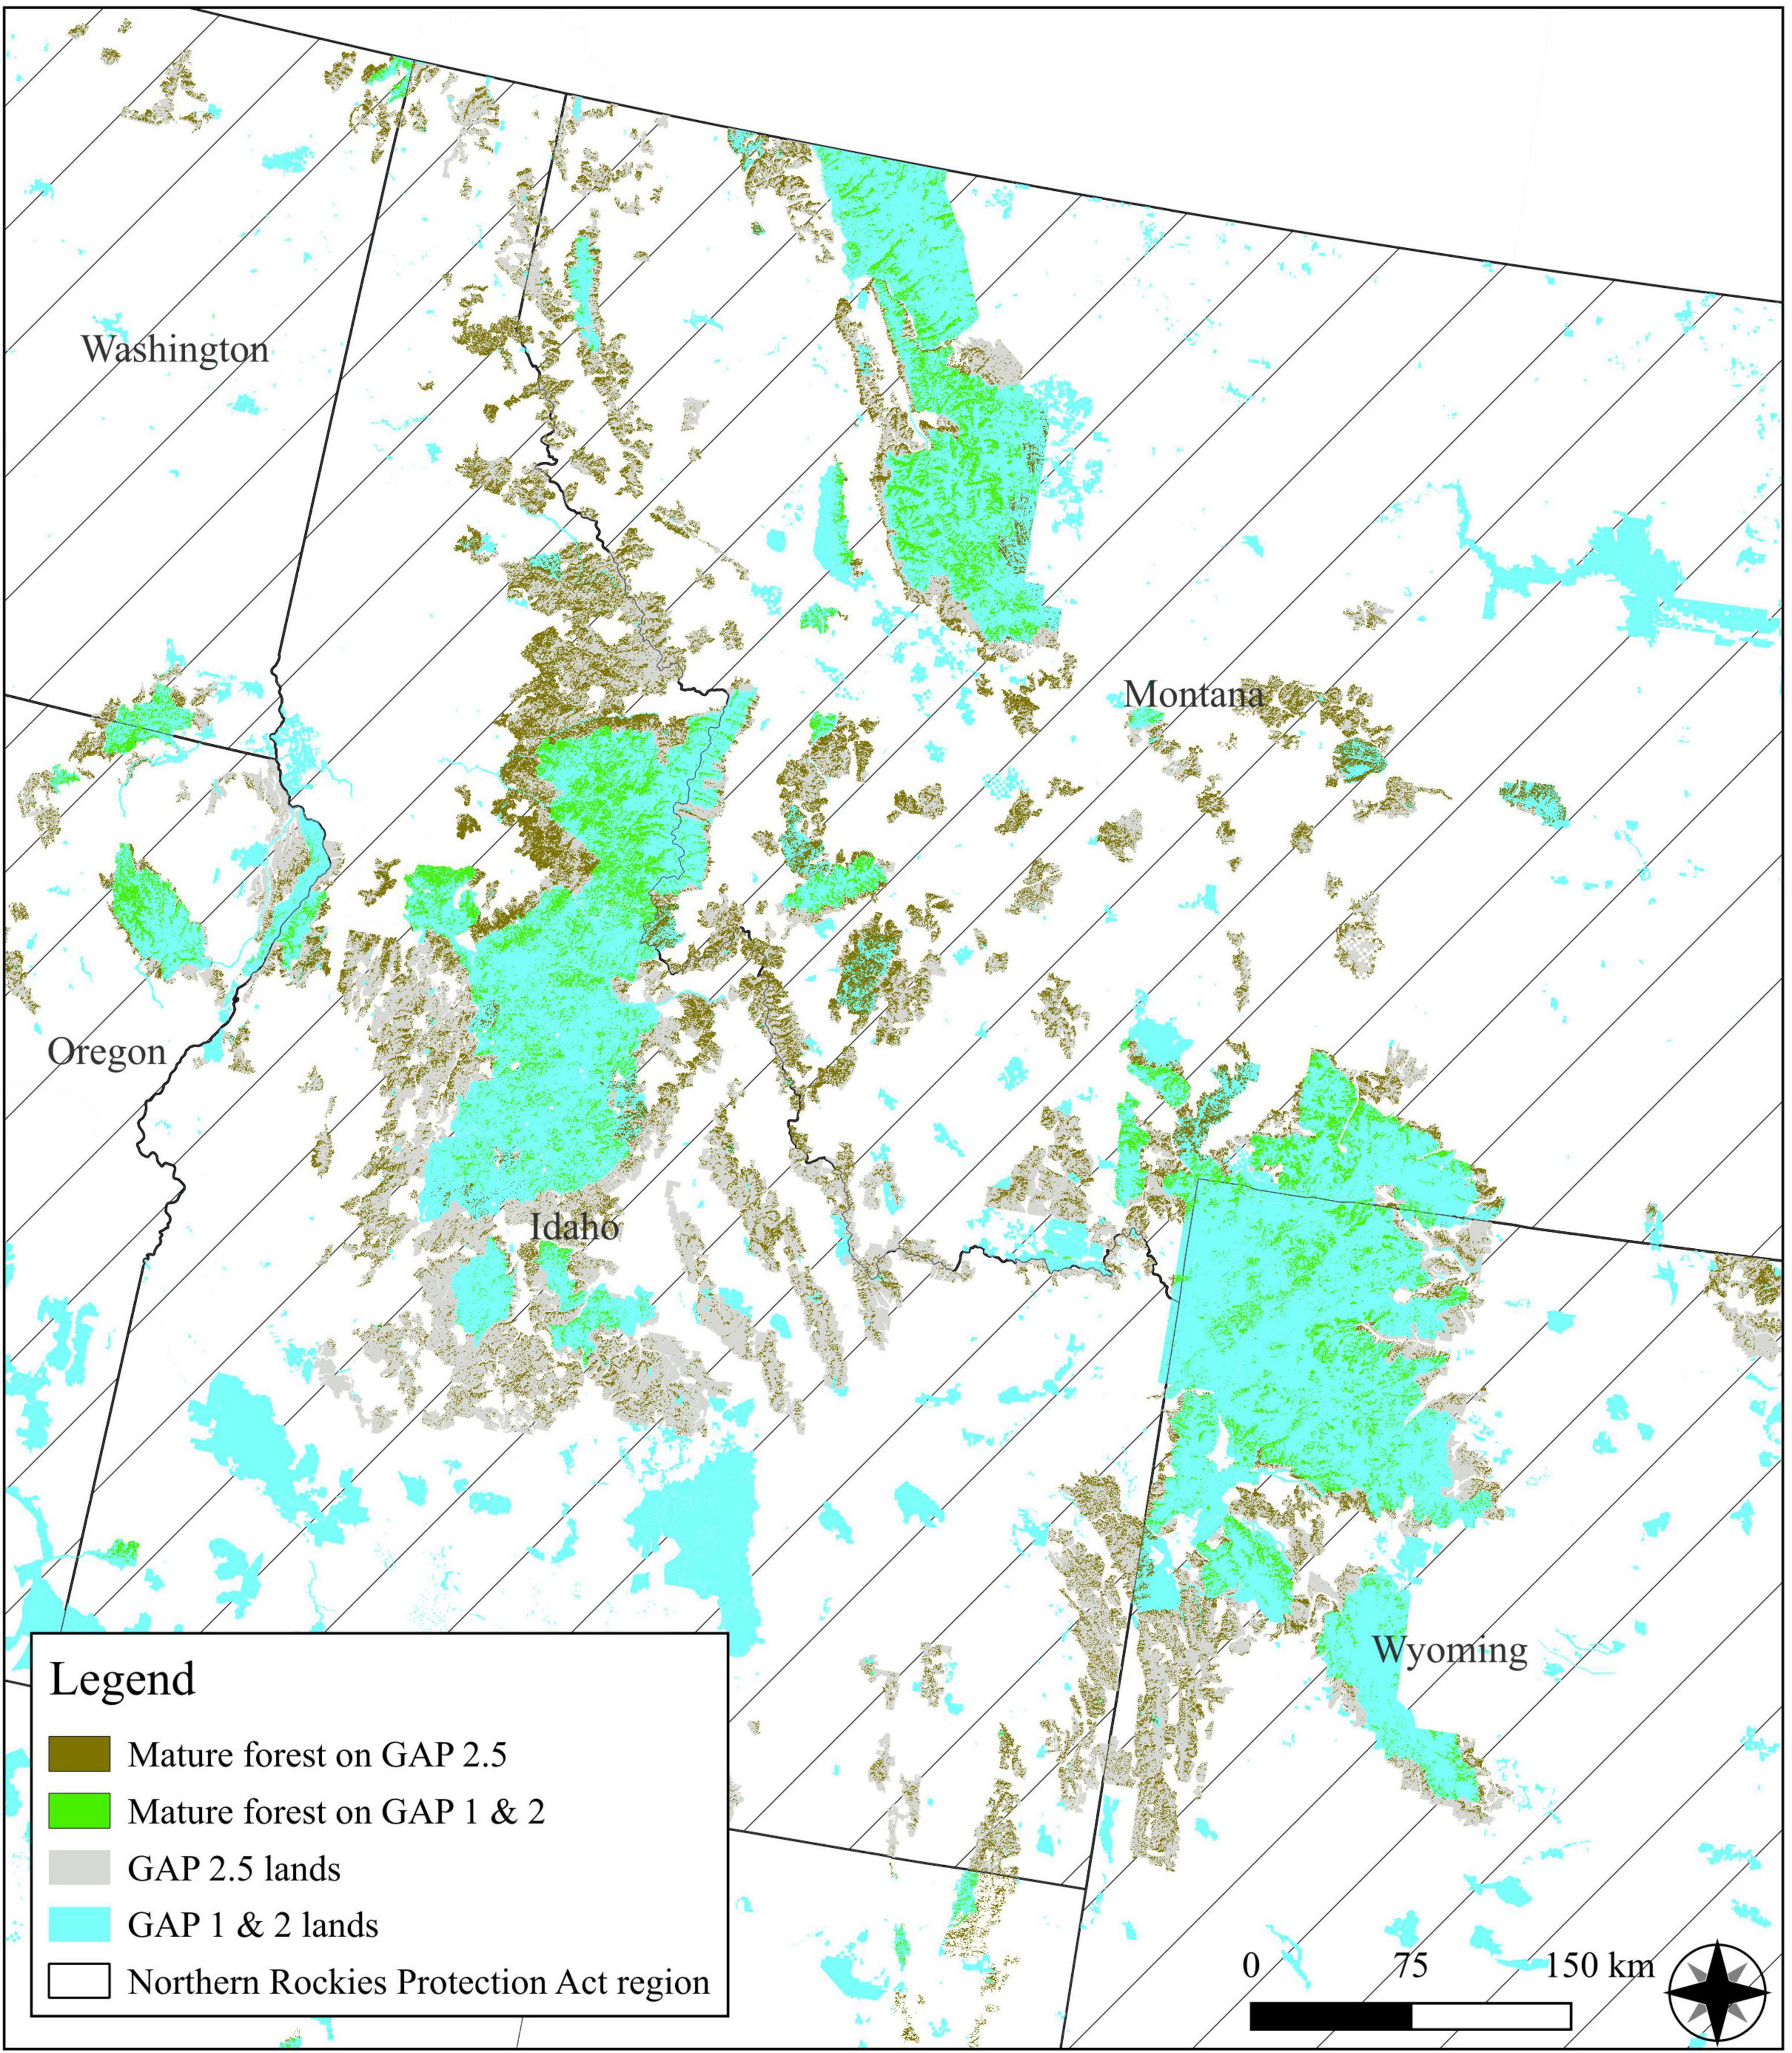
Figure 5. Distribution of mature and old-growth forests within the proposed five state protection area (OR, WA, ID, MT, and WY) including the Bader (2000) and Northern Rockies Ecosystem Protection Act (2021) by GAP classifications. GAP2.5 refers to Inventoried Roadless Areas (IRAs) that are not fully protected.
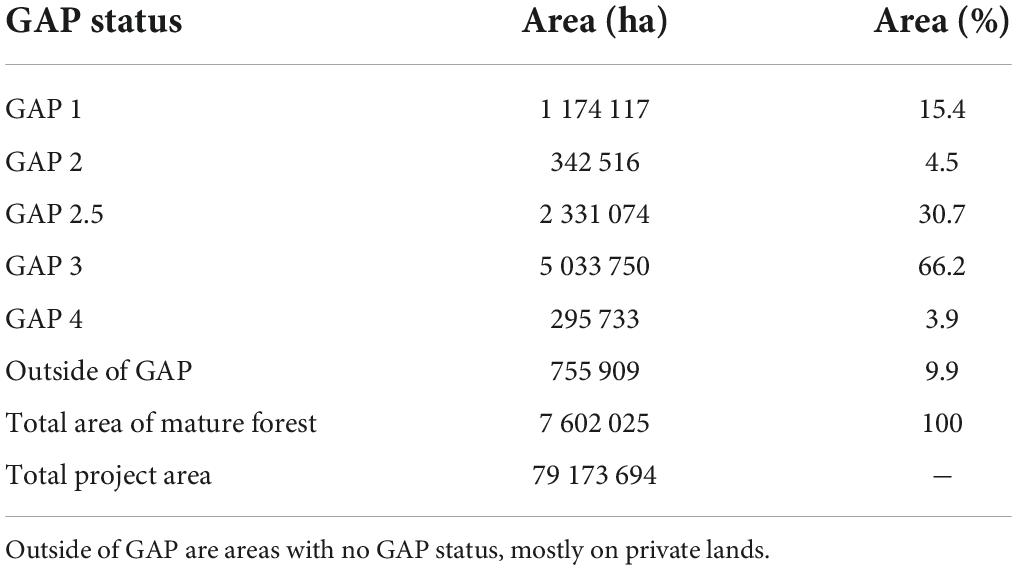
Table 2. Mature and old-growth forests area (%) within the proposed five state protection area (OR, WA, ID, MT, and WY) that includes Northern Rockies Ecosystem Protection Act by GAP status.
Mature and old-growth forests major forest types
Mature and old-growth forests were located within 22 forest groups spanning conifer and hardwood types in the conterminous United States (Table 3). Nearly all MOG types had their greatest percentages in unprotected status (GAP3, 4; no classifications) with only 14.7% overall in GAP1 and 2 and 7.1% in GAP2.5. Only two forest types, Fir (Abies sp.)/Spruce (Picea sp.)/Mountain Hemlock (Tsuga mertensii) (33.1%) and Other Western Softwoods (41.3%) met the lower bound (30%) target. Percentages would improve for several forest groups if IRAs (GAP2.5 status) received higher protection status. Importantly, FIA major forest classifications inappropriately lump longleaf (Pinus palustris) with slash pine (Pinus elliottii)-dominated communities as one equivalent forest type, thereby obscuring the imperiled conservation status and biodiversity of longleaf pine wiregrass (Aristida stricta) communities. For instance, there are five distinct longleaf pine ecosystem types mapped nationally and assessed under the IUCN Red Listing criteria (Comer et al., 2022), with two listed as Critically Endangered, and three as Endangered that do not show up on the FIA dataset.
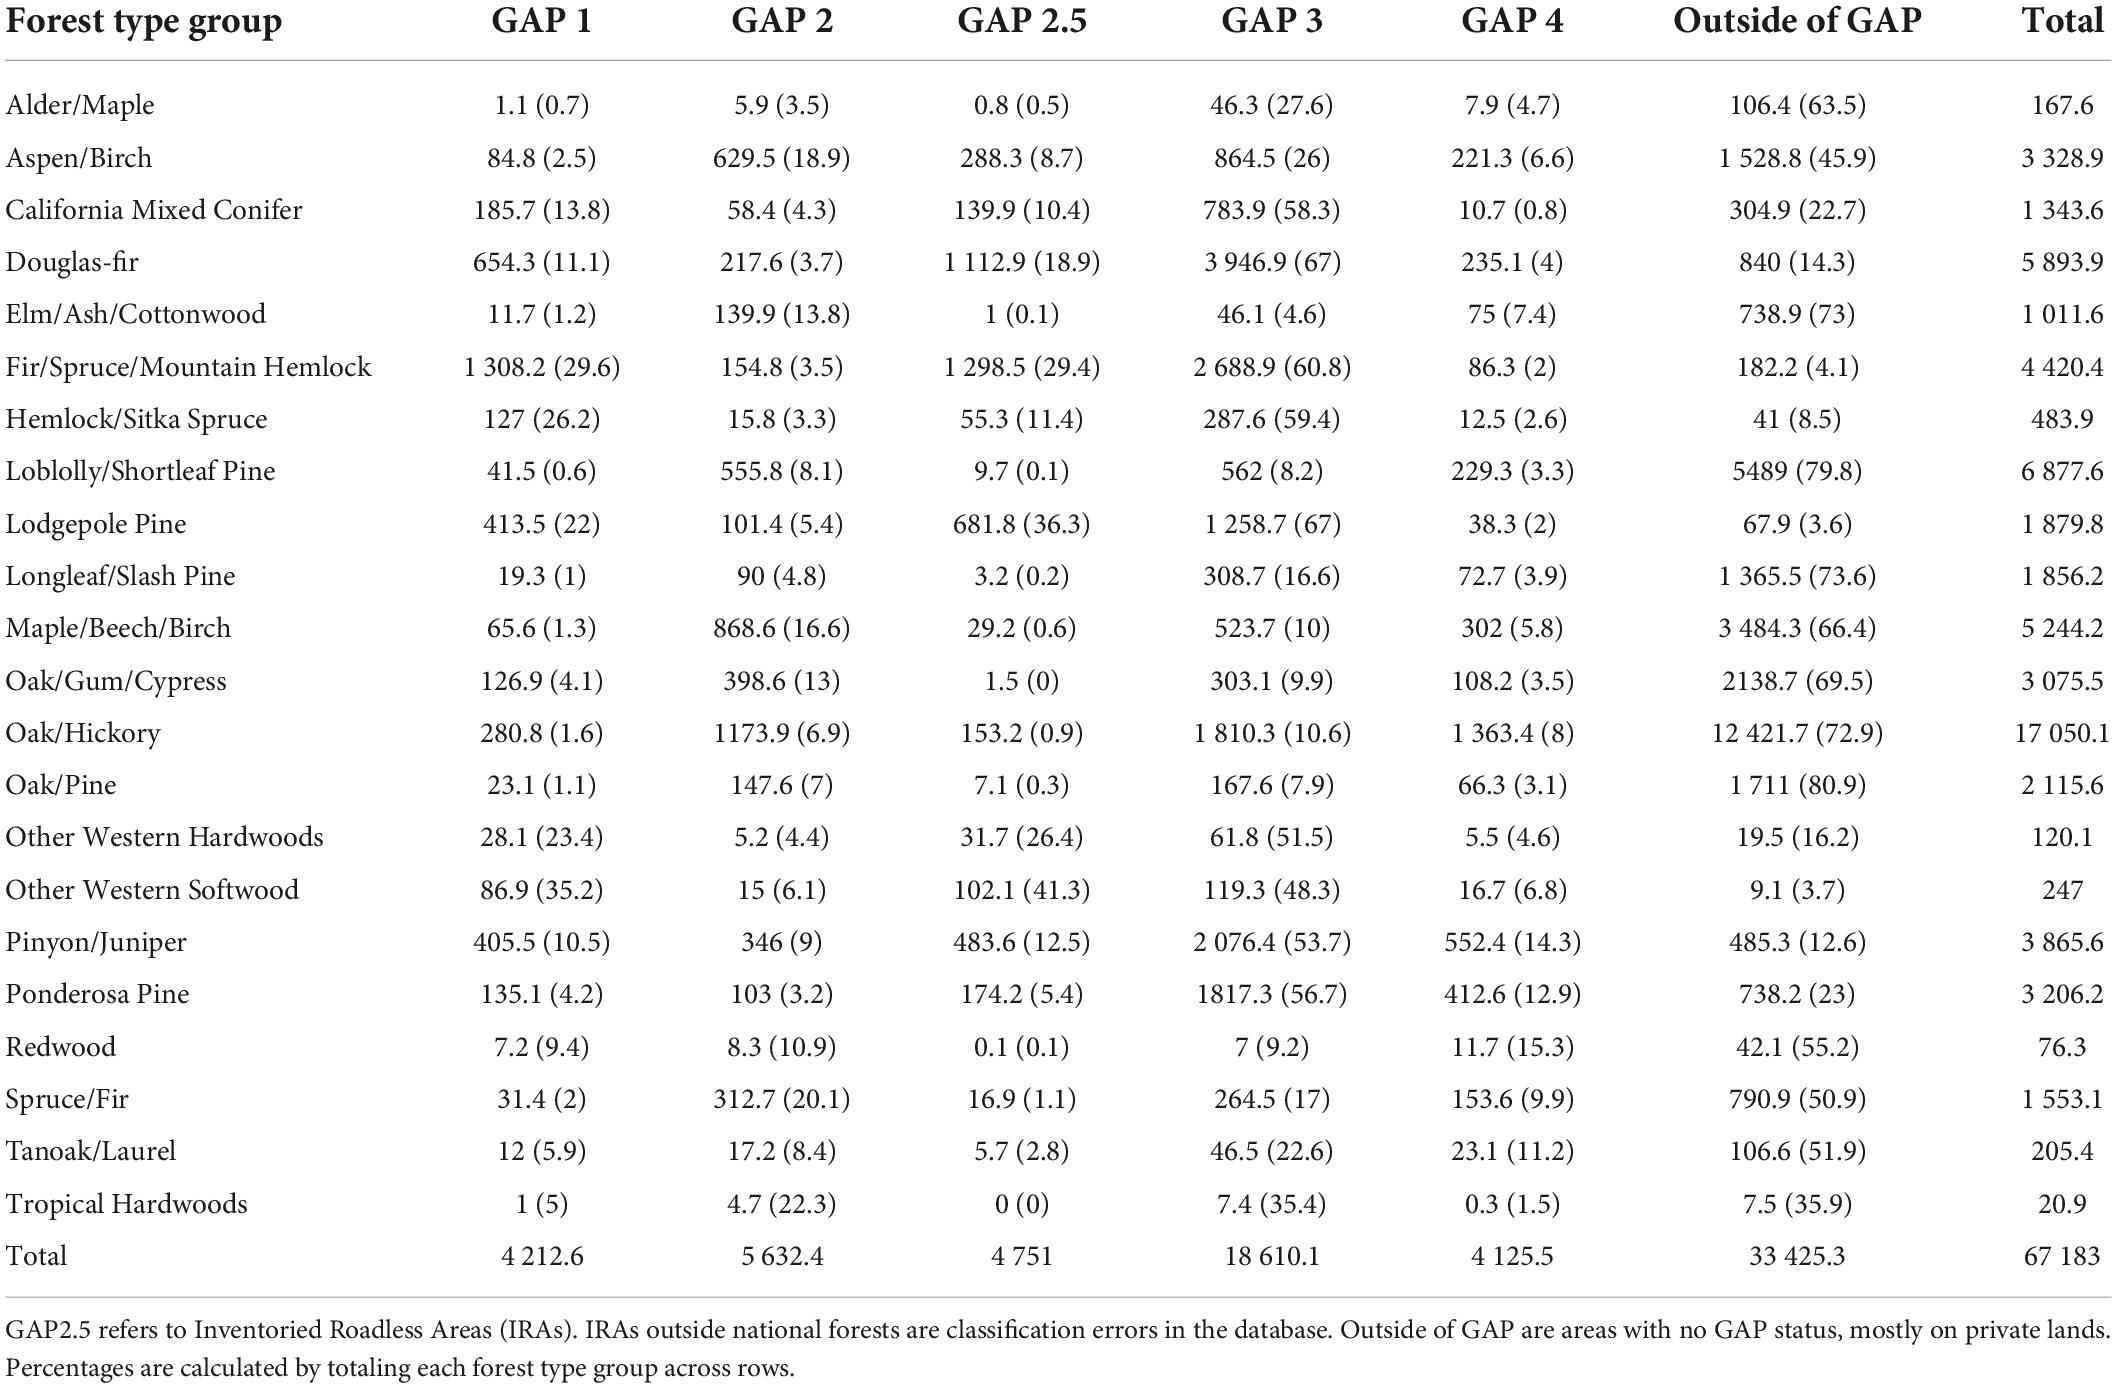
Table 3. Area (×1000 hectares) and percent (%) of mature and old-growth forest within each Forest Inventory and Analysis (FIA) forest type group.
Mature and old-growth forests land ownership and GAP analysis project status
Federal lands (36%) have the highest proportion of MOG, of which, National Forests have most (∼92%) of the federal total (Table 4). Approximately 24% of MOG on national forest lands are in GAP1 and 2 (Table 4). An additional 22% of MOG is within IRAs (GAP2.5). If IRAs received elevated conservation status, that would increase MOG protections in National Forests to 46%, which is within reach of the mid-level 50% target. Supplementary Table 1 has a breakdown of MOG by GAP status for every national forest.
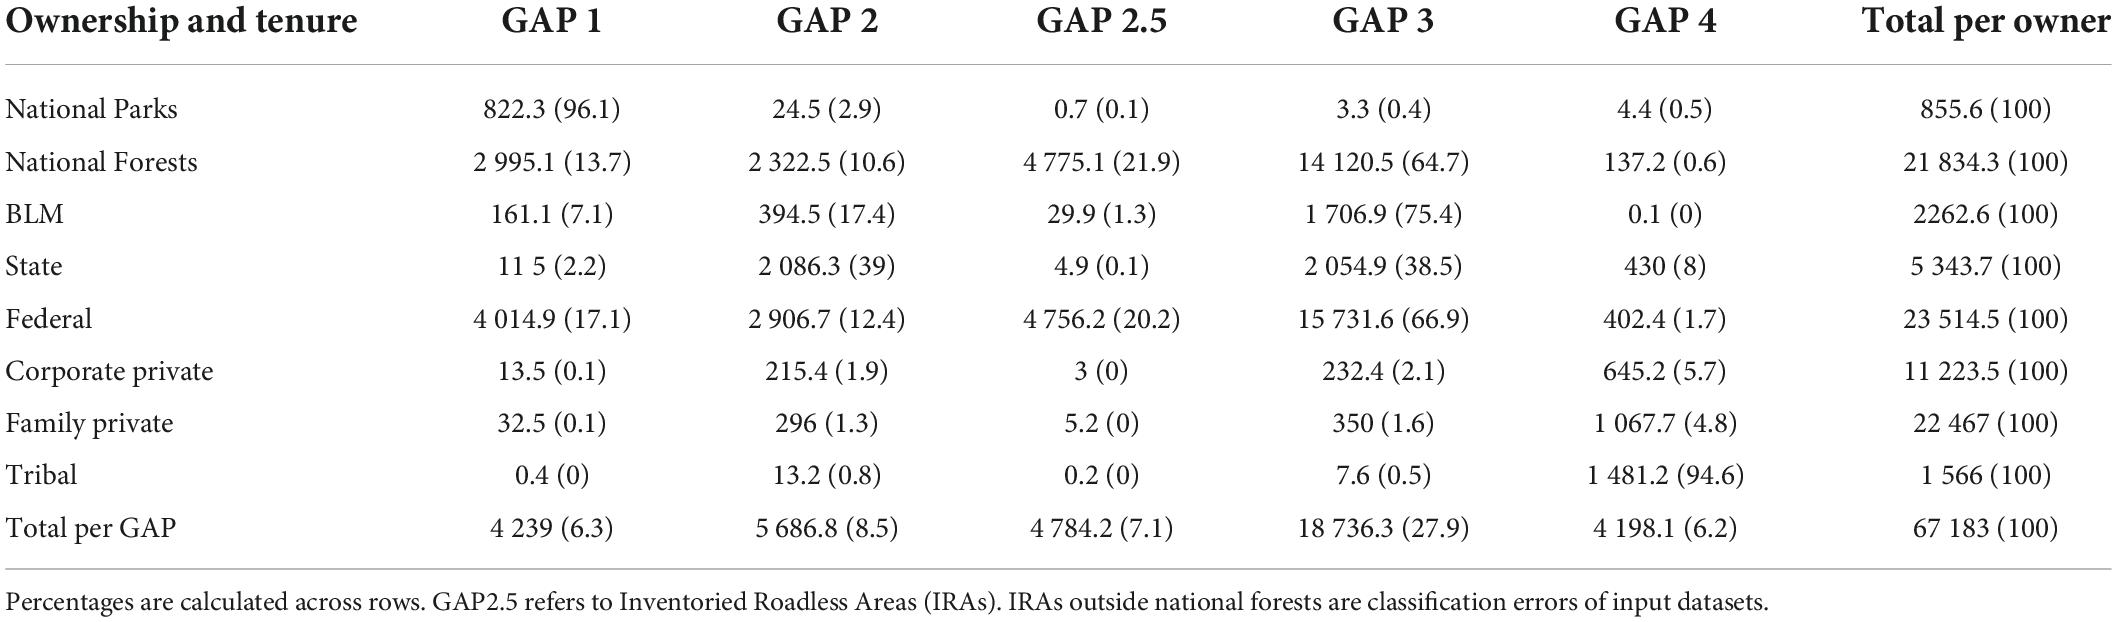
Table 4. Total area of mature and old-growth forests (×1000 ha) and percent (parenthesis) for the conterminous United States by GAP and ownership.
The rest of MOG on federal lands are held by the National Parks (∼3%) and BLM (∼9%) (categories overlap some due to mapping errors in the datasets). BLM lands in particular are mostly non-forested with some notable exceptions such as in southwest Oregon. However, like National Forests, only ∼24% of MOG on BLM lands have GAP1 and 2 status (Table 4). Of non-federal lands, MOG were highest on family private (55%) and lowest on tribal (∼4%). Interestingly, state lands (41%) were the only non-federal category where a lower bound 30% target was met but they did not have much MOG overall. All other non-federal tenures were well below even the lowest 30% target.
Mature and old-growth forests above-ground living biomass
Aggregate above-ground living biomass values in MOG are by far highest on national forests, which contain 45% of the total above-ground living biomass for all ownerships (Table 5). For non-federal lands, family private has the most (52%) above-ground living biomass and tribal (4%) the least. The ratio of carbon to above-ground living biomass is typically taken to be 0.5 (i.e., about 50% of the dry weight of biomass is carbon) though globally the ratio can range from 0.4–0.6 (Keith et al., 2010).
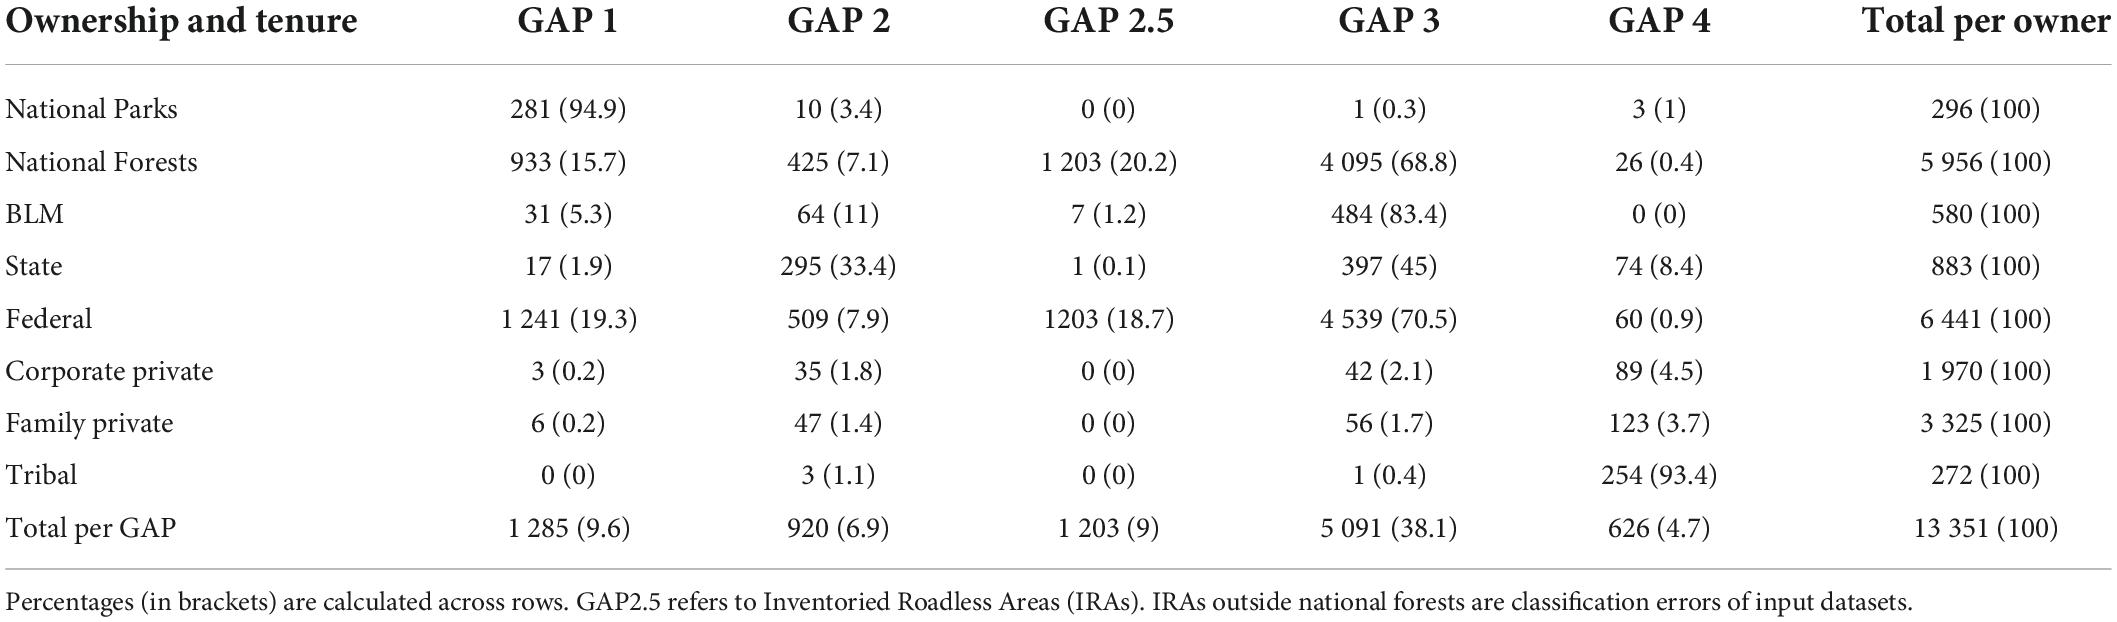
Table 5. Total-above ground living biomass within mature and old-growth forests (×1 M tons) by GAP and ownership.
Mature and old-growth forests red list of ecosystems
Of the 182 forest and woodland ecosystem types assessed with criteria from the IUCN RLE in the United States, 119 (65%) were categorized from near threatened (NT) to critically endangered (CR); collectively considered here as “threatened” (Figure 6). The 102 types categorized as vulnerable (VU) through critically endangered (CR) occurred on 38% of current forest area. Critically endangered and endangered forest ecosystems were concentrated in the eastern states; mostly in areas with the longest and most intensive land use histories. Types found there included Southeastern Interior Longleaf Pine Woodland, Atlantic Coastal Plain Fall-line Sandhills Longleaf Pine Woodland, and West Gulf Coastal Plain Sandhill Oak and Shortleaf Pine Forest and Woodland (Supplementary Table 2). Forest type descriptions are maintained for public access on NatureServe Explorer10 (accessed September 4, 2022).
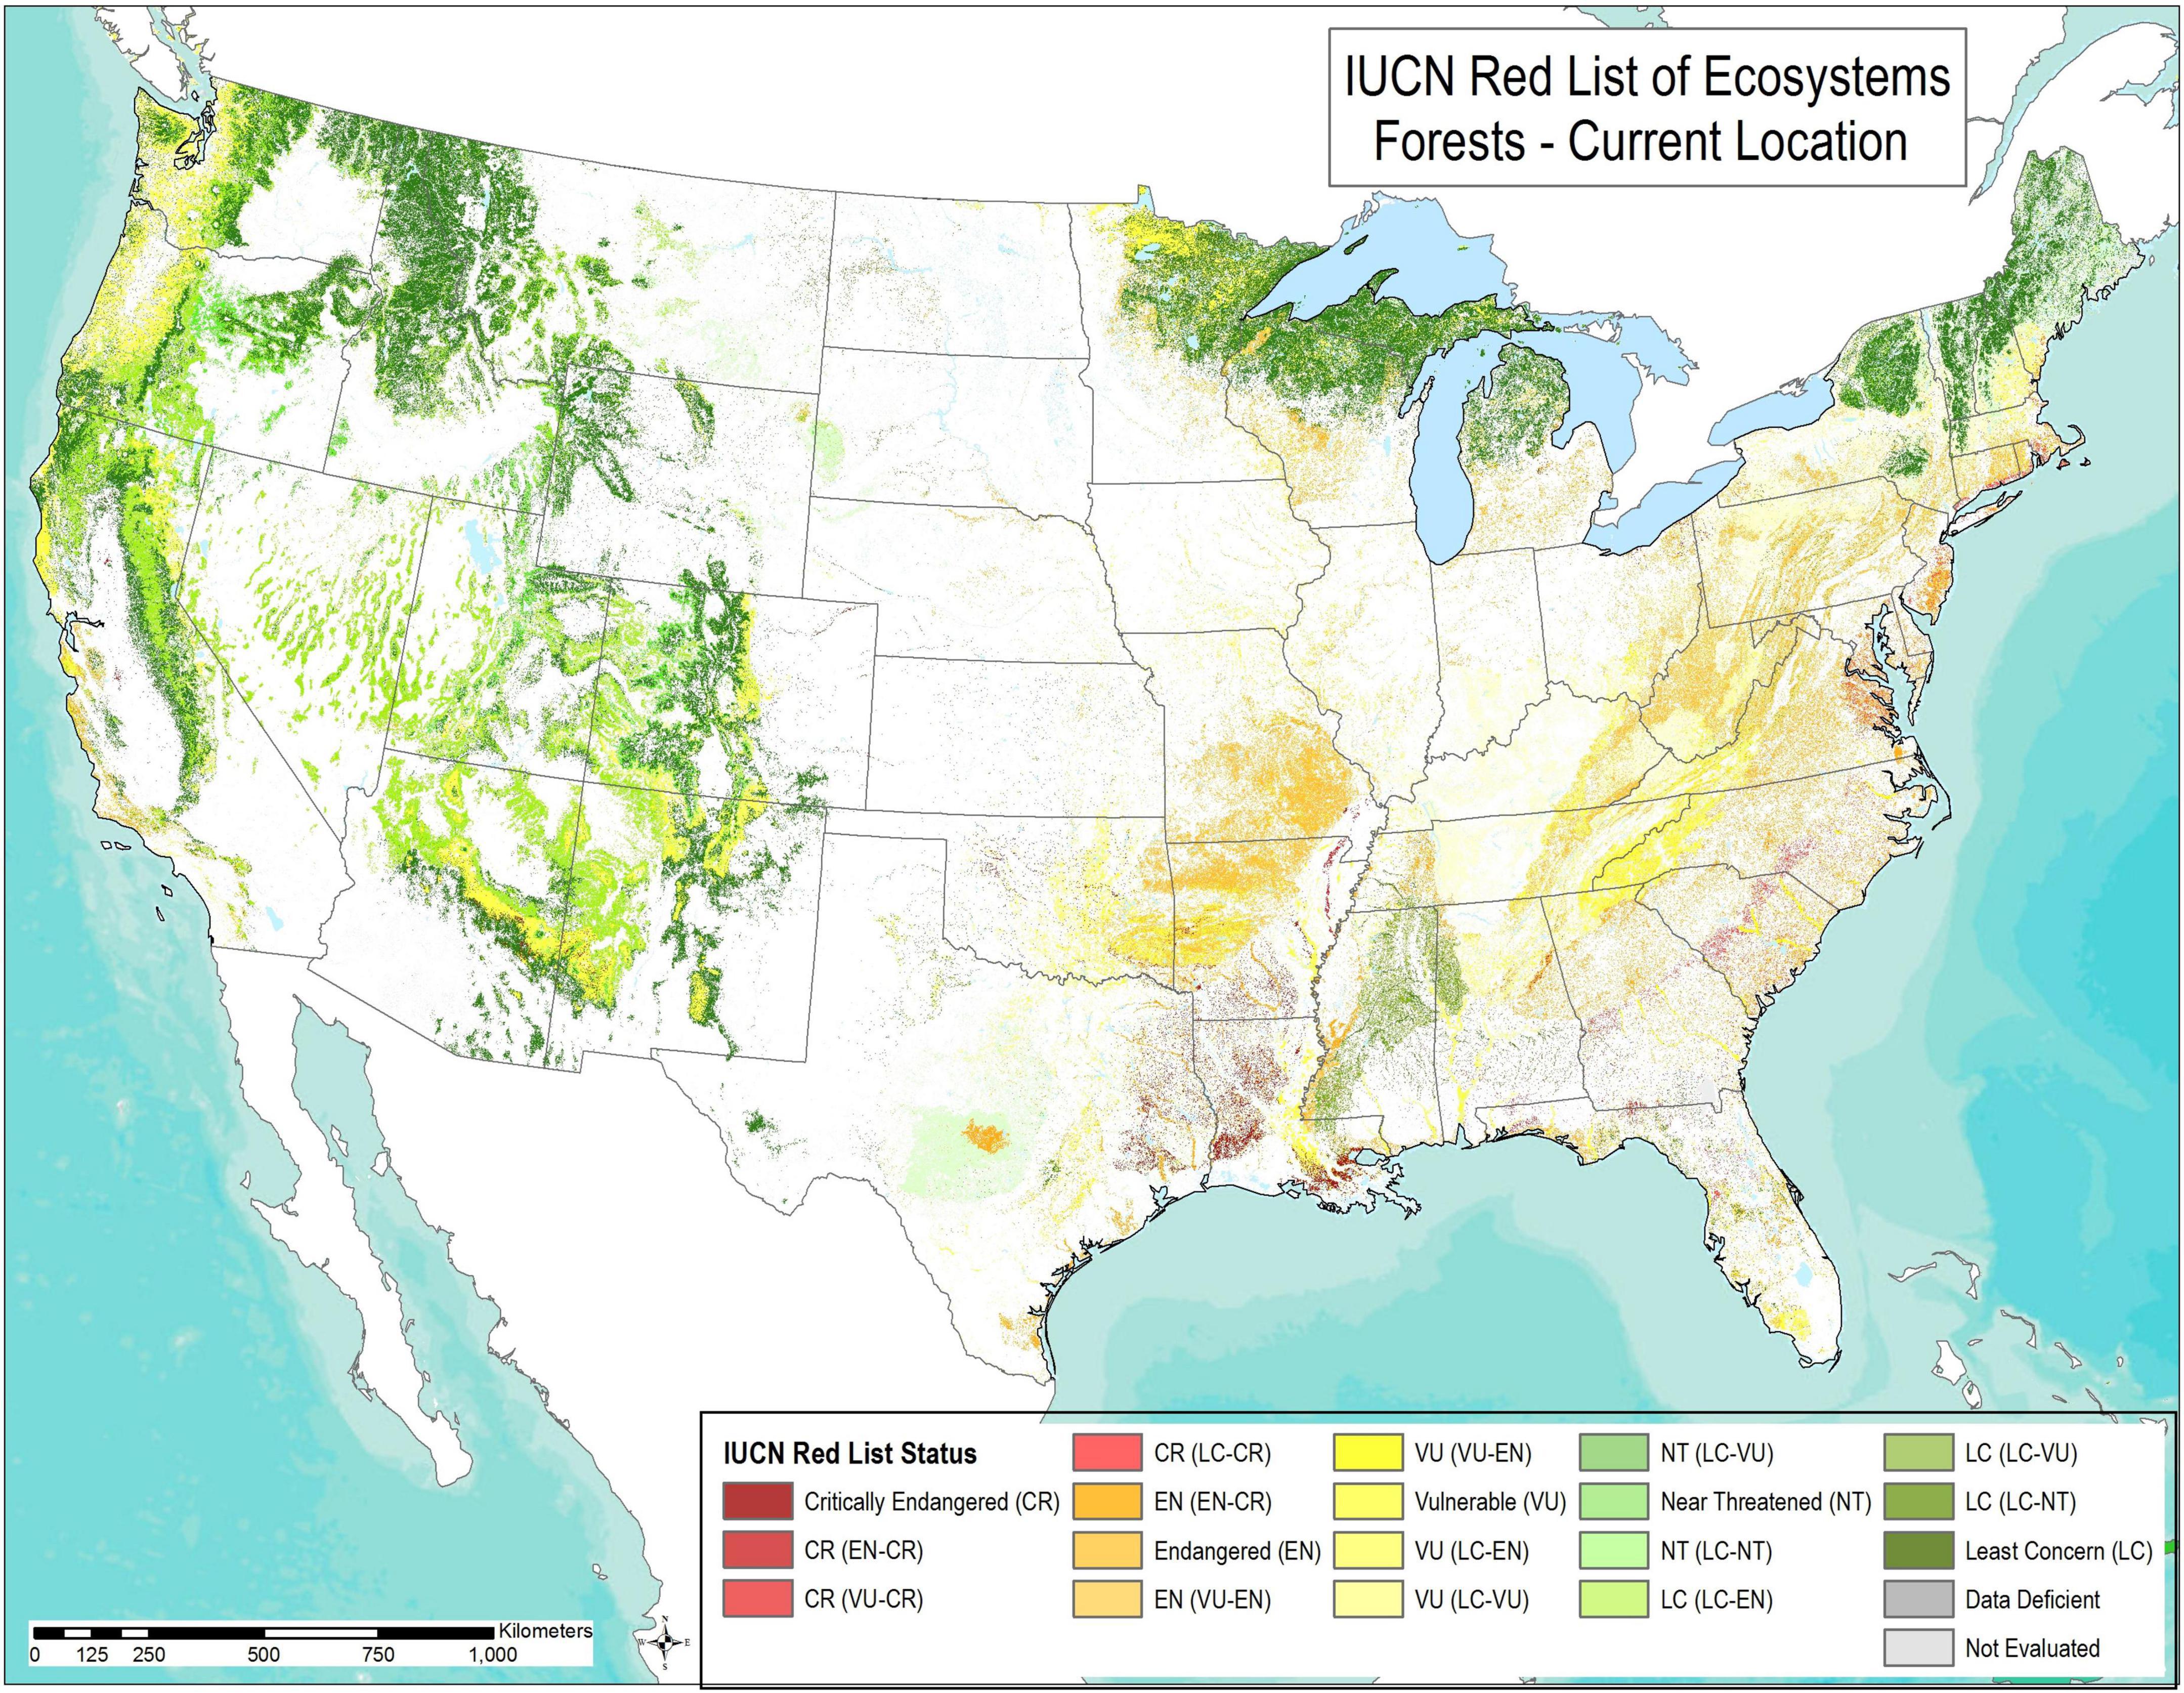
Figure 6. Current distribution of 182 forest and woodland ecosystem type categories under the IUCN Red List of Ecosystems (Comer et al., 2022). Nearly all these distributions include mature and old-growth forests (Supplementary Table 2).
Large proportions of MOG under GAP1 to GAP 3 status include types categorized by the IUCN RLE as Least Concern (Table 6). About 39.4 M ha (394,000 km2) of all at-risk (NT-CR) forests and woodlands occurred within area mapped as MOG. While current area of critically endangered forests was quite limited overall, most at-risk forest mapped as MOG was categorized as Near Threatened, Vulnerable, or Endangered. These were commonly located on either federal land, predominately national forests, or family private (Table 6). Importantly, ∼12.1 M ha (18%) of MOG with threatened status were located within GAP3 status under multiple use management. These were, for example, North Pacific Maritime Mesic-Wet Douglas-fir (Pseudotsuga menziesii)-Western Hemlock (Tsuga heterophylla) Forest (VU) in the Pacific Northwest, and Southern Rocky Mountain Ponderosa Pine Woodland (VU) in the southern Rocky Mountains (Figure 6). The other large proportion of threatened MOG occurred on family private land, mostly throughout the eastern states (Figure 6). Examples included Ozark-Ouachita Dry Oak Woodland (EN), Allegheny-Cumberland Dry Oak Forest and Woodland (EN [VU-EN]), or Southern Piedmont Mesic Forest (EN [VU-EN]).
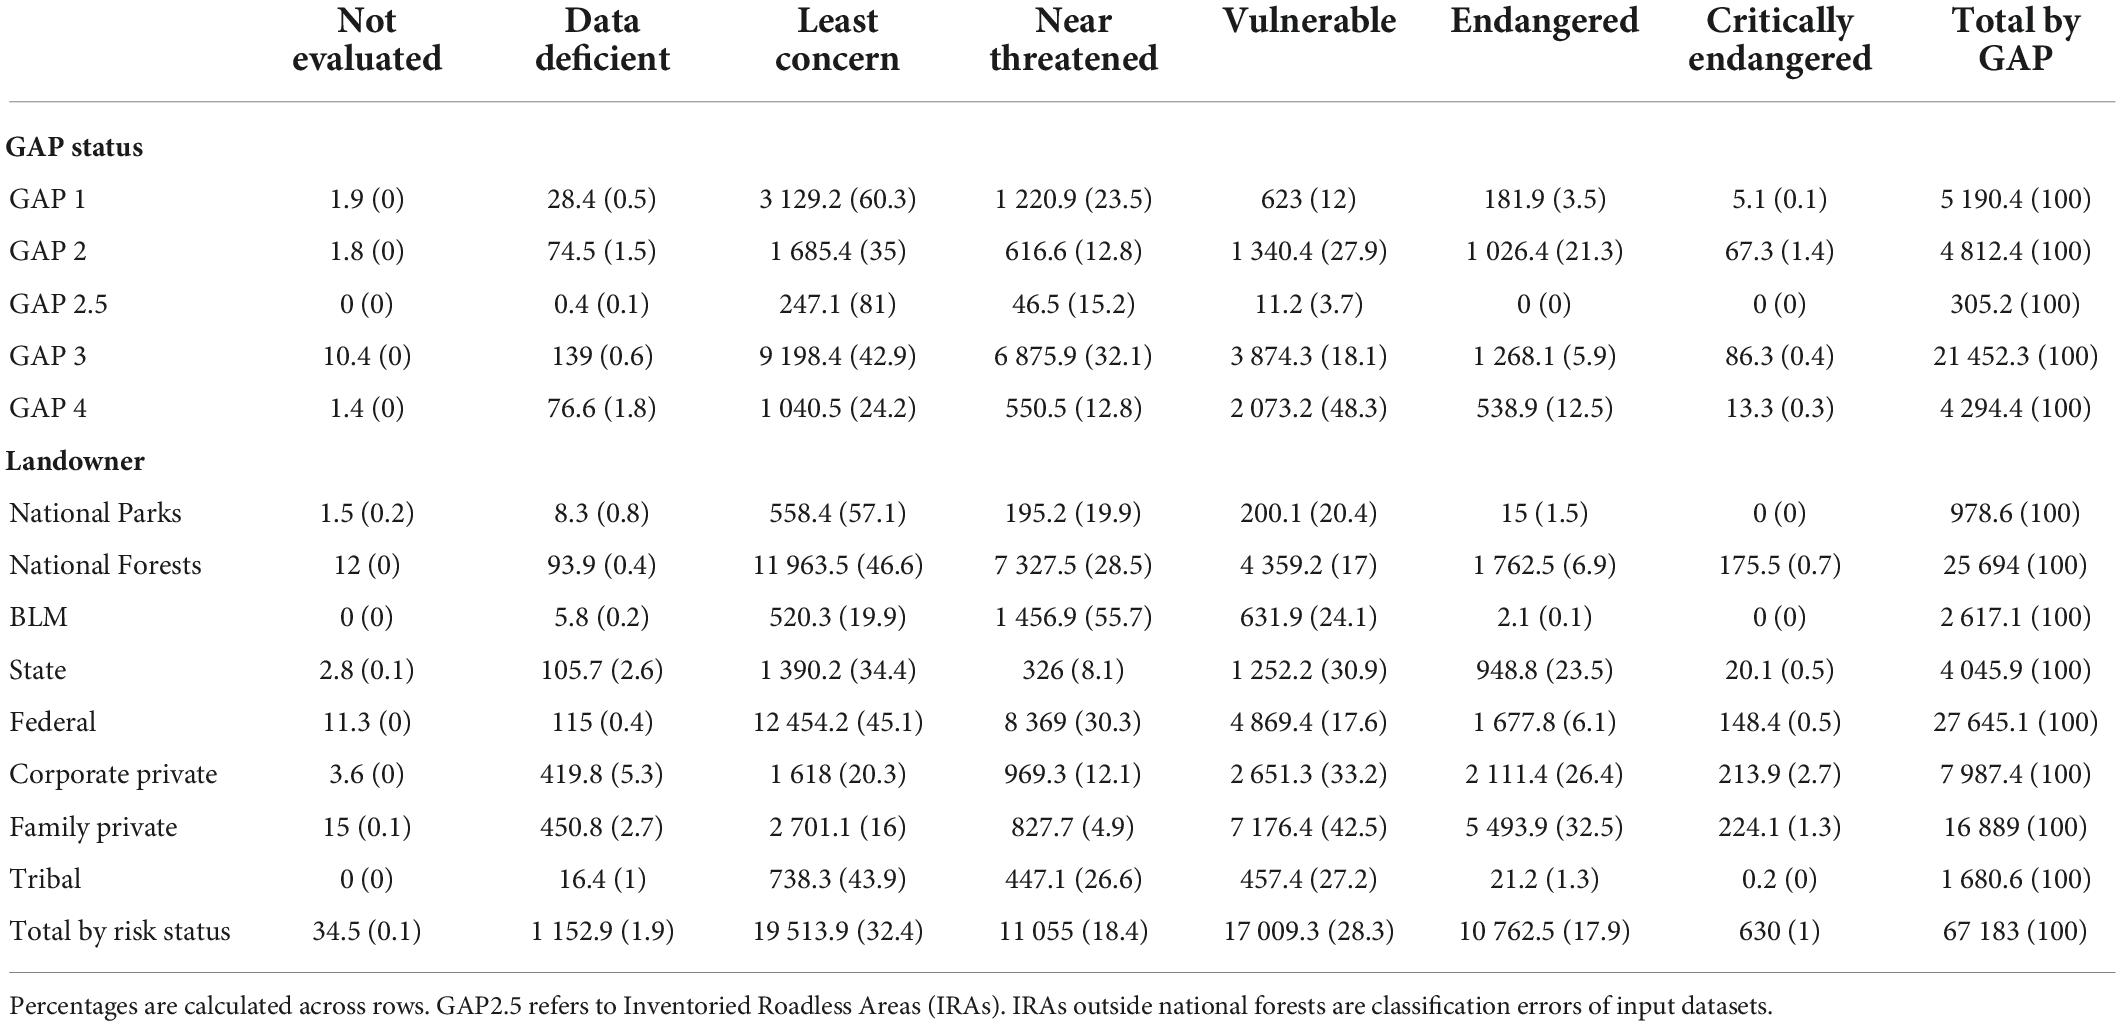
Table 6. Area of land (×1000 ha) and percentage area (parentheses) for each of the identified Red Listed Ecosystem (RLE) risk status by GAP and landowner.
Mature and old-growth forests and at-risk species
Using documented relationships between species of concern and forests, there were 97 mapped forest ecosystem types known to support at-risk species (Supplementary Table 2) and the listed species are maintained for public access on the NatureServer Explorer (see text footnote 10; accessed September 5, 2022) under individual forest type summaries. MOG was present in 29.2 M ha of these mapped forest ecosystem types. Species considered “at-risk” within forest types using NatureServe conservation status ranks included Vulnerable (G3), Imperiled (G2) or Critically Imperiled (G1) (Stein et al., 2000). From 1 to 64 of these at-risk species were associated with the 97 mapped forest types. Forest types with the most MOG that also included at-risk species were, for example, Laurentian-Acadian Northern Hardwood Forest (37,644 km2 and 12 at-risk species), South-Central Interior Mesophytic Forest (16,046 km2 and 50 at-risk species), and Southern Appalachian Oak Forest (10,190 km2 and 48 at-risk species). Using United States Endangered Species Act (i.e., Threatened or Endangered, as well as Candidate or Proposed) as another measure of at-risk species status, 1 to 15 at-risk species were documented for their association with these 97 forest types. Among those supporting >1 at-risk species and with the extensive area in MOG were, for example, North Pacific Maritime Dry-Mesic Douglas-fir-Western Hemlock Forest (10,370 km2 and 4 at-risk species), East Gulf Coastal Plain Large River Floodplain Forest (4,295 km2 and 13 at-risk species), and Atlantic Coastal Plain Blackwater Stream Floodplain Forest (2,417 km2 and 8 at-risk species).
Of the 97 forest ecosystem types with habitat relationships documented for at-risk species, 70 were considered threatened (IUCN NT, VU, EN, or CR) themselves. Threatened forest types support at-risk species (based here on NatureServe Conservation status ranks) with the most extensive area mapped as MOG in South-Central Interior Mesophytic Forest (EN) (16,046 km2 and 50 at-risk species), Northeastern Interior Dry-Mesic Oak Forest (EN) (15, 327 km2 and 12 at-risk species), and Southern Appalachian Oak Forest (VU) (10,190 km2 and 48 at-risk species) (Supplementary Table 2).
Mature and old-growth forests and drinking water
Based on the USDA drinking water source area dataset, MOG with the highest drinking water value (Class 4) were mostly on Federal lands with surprising large areas on family private and corporate private (Table 7). Importantly, a substantial (4.5 M ha, >39%) amount of the highest quality drinking water comes from MOG within GAP3 and 4 status, and much more (12.1 M ha) is outside GAP status all together. Any loss of these forests due to logging and development would potentially impact drinking water supplies.
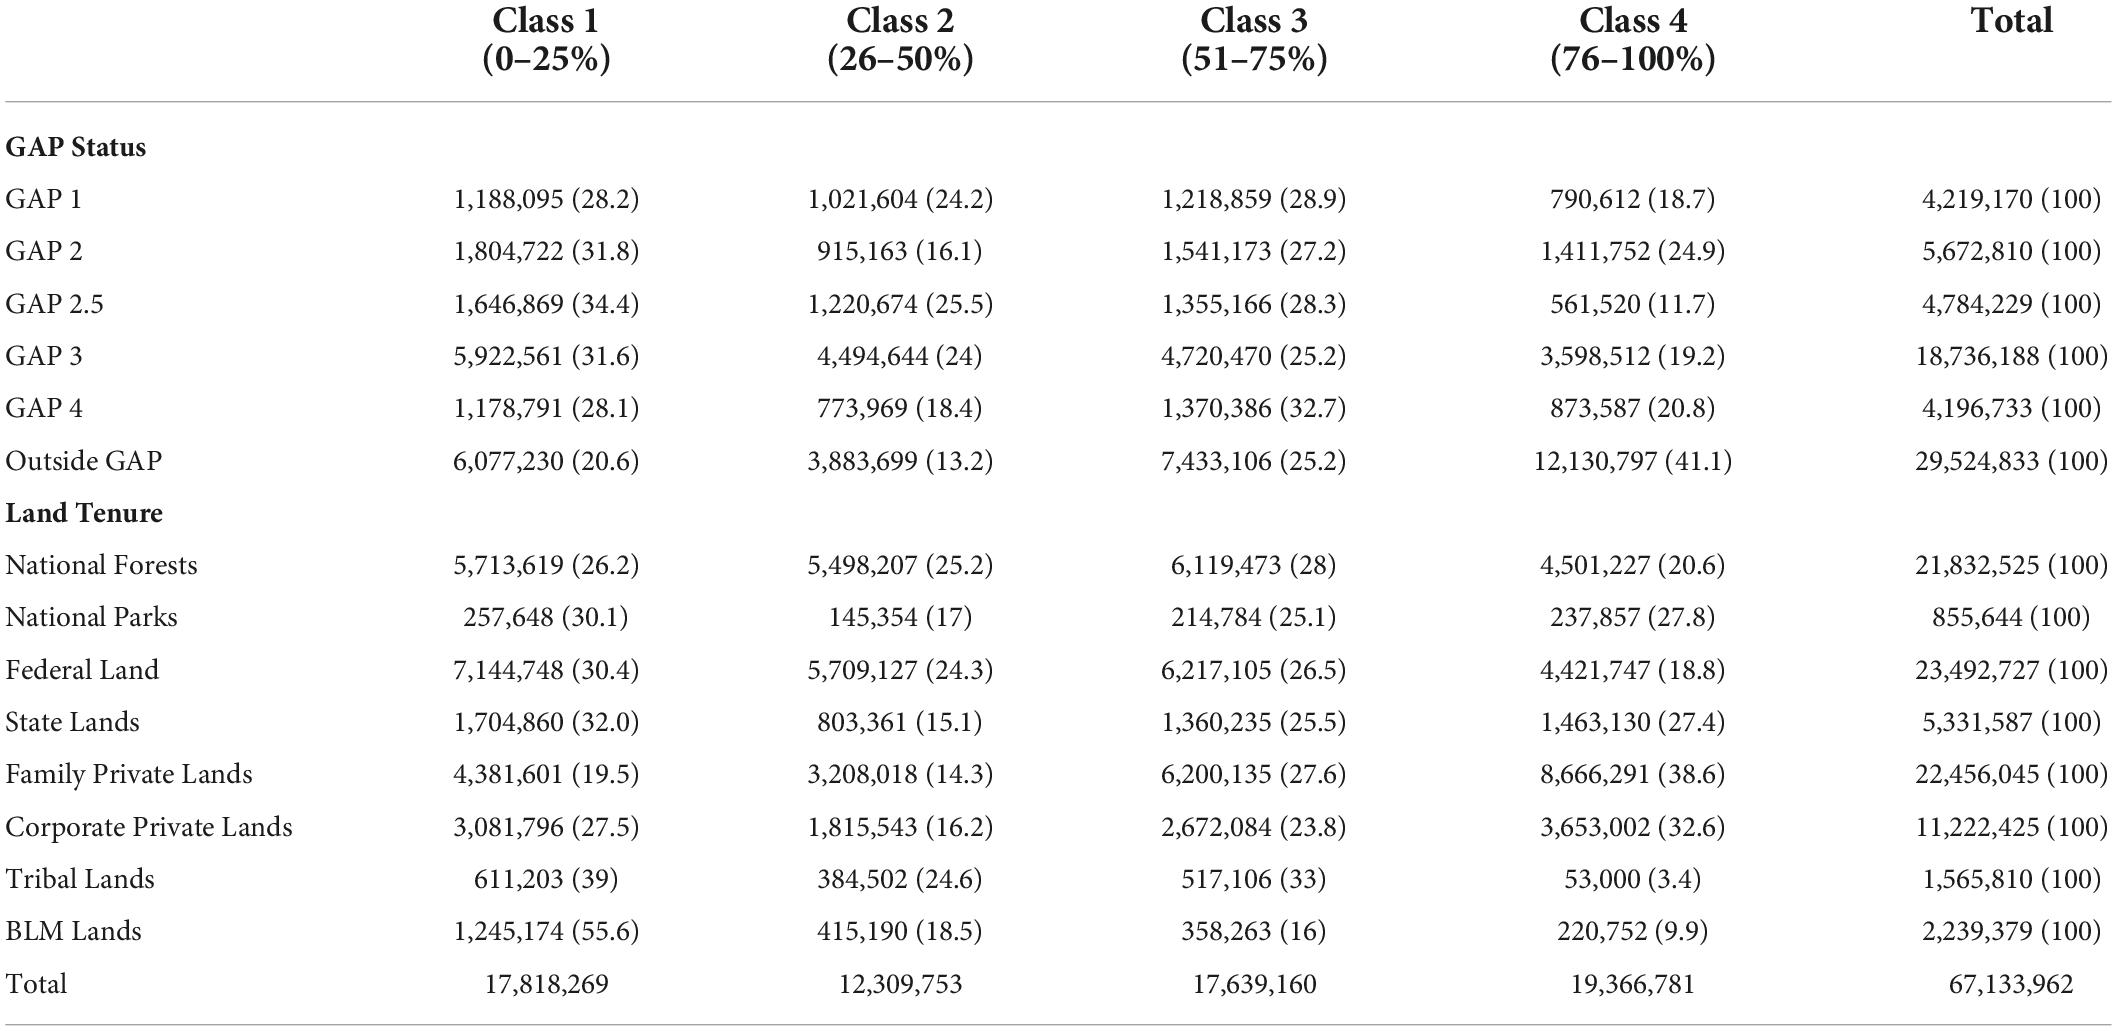
Table 7. Mature forest area (ha) in each relative importance to surface drinking water class by GAP status and land tenure, with percentage of total mature and old-growth forest in the respective GAP/Tenure.
Discussion
Mature and old-growth forest structure and spatial analysis
Forest age and level of stand development are typically measured through tree ring analysis (e.g., core drill samples from living trees) and diameter distributions of dominant trees but can also be assessed using models based on measurements of forest structure—canopy height, canopy cover, biomass, as in our study. Other forest structural development characteristics indicative of the later stages of forest development include vertical vegetation layering and coarse woody debris (not measured in our study). Differences in the longevity, life history traits and niche requirements of tree species means that in many ecosystem types, the taxonomic composition of the dominant canopy species can reflect stages progressing from early to late seral. Gap-phase dynamics are diagnostic of the most structurally advanced old-growth. Furthermore, environmental factors that regulate plant growth, ecosystem processes rates and site productivity—thermal, moisture, radiation and nutrient regimes—result in variation within the ecosystem type of forest structure classes in terms of tree height, canopy density, and above-ground woody biomass.
Pan et al. (2011) used 2006 FIA plot data and remote sensing data at 1-km resolution to produce an age class distribution map in discrete age intervals of North American forests. Our inventory provides an updated and continuous-based structure map at 30-m resolution for tracking future changes in ecological development and management of MOG that can be updated as new datasets and advancements in monitoring technologies become available. We estimate 67.2 M (∼36% of all structural classes) of MOG are scattered across eight geographic regions in the conterminous United States that provide options for stepped up national and regional conservation. With the exception of IRAs, MOG are mostly not large contiguous blocks as they are nested within a highly fragmented matrix that has contributed to edge effects and diminished ecosystem functions (see Heilman et al., 2002).
Federal lands
Combined federal lands represented ∼35% of the total MOG structural classes with most (∼92%) on national forests and a fraction managed by National Parks (∼3%) and BLM (9%) (some overlap in mapping datasets). MOG on federal lands have the highest conservation values reflective of their above-ground living biomass, at-risk ecosystems and species, and drinking water source areas. However, only 24% of MOG on national forest and BLM lands each are fully protected, which is below even the lowest bound 30% target. Our analysis supports 100% of federal MOG for inclusion in protected areas based on their superior climate, water, and biodiversity associated values. We note that adding ∼20.8 M ha of unprotected federal MOG to the United States protected areas network would still fall far short of the 30% target for all lands and waters given only 12% of all types are protected nationally. To achieve a near tripling of protections nationally on top of 20.8 M ha of proposed MOG protections would still require another 125 M ha of new protections from all types and landowners (National Geographic, 2021).
An alternative scenario is that the unprotected federal MOG in GAP2.5, 3, and 4 status is logged and then regrown. The consequences of this logging on exacerbating climate change can be assessed in terms of the projected emissions and their effect on the atmospheric CO2 concentration. A comparison of protected vs. logged federal MOG allows the mitigation benefit of protecting MOG to be further evaluated in terms of carbon emissions avoided. The area of 20.8 M ha at-risk MOG on federal lands currently stores ∼5.8 Gt of above-ground living biomass (Federal land GAP 2.5 + 3 + 4; Table 5), which is equivalent to 10.64 Gt CO2. It is assumed that 50% of the carbon that had been stored in the biomass of logged MOG is emitted to the atmosphere due to combustion or decomposition of waste and short-lived wood products (Brown et al., 1997; Keith et al., 2014). This represents a carbon stock loss from the biosphere and a stock gain by the atmosphere. Logging emissions would remain in the atmosphere for decades and are partially removed by sinks. This can be calculated as the fraction of the airborne CO2 from each pulse of emissions that decreases over time by removals from the natural land and ocean sinks and the regrowth of the forest (Keith et al., 2022). Carbon stock remaining in the atmosphere as the airborne fraction of the emissions was estimated for 2030 (after 8 years) and 2050 (after 28 years) to comply with global emissions reduction targets and for assessing the mitigation potential of full protection. By 2030, 74% of logging emissions would remain in the atmosphere, and by 2050, 54% would remain (Keith et al., 2022). This carbon stock remaining in the atmosphere also can be converted to parts per million by volume (ppm) as the common unit to express atmospheric CO2 concentration (1 ppm = 7.8 Gt CO2) (CIDAC, 1990). If 74% of the CO2 emitted remains in the atmosphere by 2030, then 10.54 Gt CO2 emissions are required to raise the atmospheric CO2 concentration by 1 ppm. Logging emissions would consequently result in 0.5 ppm increase in atmospheric CO2 concentration by 2030 and 0.37 ppm by 2050.
The quantity of logging emissions also can be compared with the total United States emissions that were 5.8 Gt CO2e in 202011 (accessed September 5, 2022), which would be 0.532 Gt CO2 from MOG logging per year, the equivalent to 9.2% of the total annual United States emissions.
We note while such an accelerated increase in logging may be logistically unrealistic due to a number of factors (e.g., clearcut vs. selection logging, congressional appropriations, timber sale economics) not the least of which is accessibility of remaining MOG that becomes increasingly costly as easy to access sites are initially logged. However, the Trump administration issued an executive order in 2019 designed to greatly ramp up logging by 72% on national forests.12 According to conservation groups, at least some of those sales under the Trump administration are ongoing13 (accessed September 5, 2022). Additionally, legislation is routinely introduced in Congress to greatly increase federal lands logging at the expense of forest protections14. Logging unprotected MOG would also contribute to total United States emissions and make President Biden’s stated goal of emissions reduction of 50–52% by 2030 far more difficult to achieve. Conversely, not logging these unprotected MOG would avoid the decadal logging equivalent of ∼0.5 ppm CO2 (5.32 Gt CO2) or ∼9% of United States total annual emissions, which would make a meaningful mitigation contribution to the world as natural climate solutions (Griscom et al., 2017; Moomaw et al., 2019; Keith et al., 2022). It is this current decade that is critical for mitigation actions to avoid emissions and not to add to the atmospheric CO2 concentration, including those from the land-use sector.
The IRA component of MOG represents what remains of intact blocks on national forests. Elevating the conservation status of IRAs to GAP2 would increase MOG protections on national forests to that approaching the mid-bound (50%) target. However, that would take either an act of Congress or administrative changes that remove exemptions for logging and other development projects (e.g., hydroelectric development, mining) along with new regulations making it difficult to overturn roadless protections in general. The national roadless conservation rule has sustained 14 legal challenges upheld in appellate courts, was overturned twice on the Tongass National Forest in Alaska by pro-development administrations (i.e., George W Bush and Donald Trump), and was substantially changed by state petitions to the federal government in Idaho and Colorado. Increasing administrative or congressional IRA protections is key to elevating the conservation status of IRAs so they can be considered GAP2. While there is no comparable roadless policy for BLM lands, MOG could be nominated to the National Landscape Conservation System15 (accessed May 15, 2022). The BLM oversees 14 M ha of mostly iconic lands and waterways designated by Congress or presidential executive order mainly for conservation purposes that includes national monuments and other protective designations.
Regional
Federal forests in the Eastern region are maturing from logging that eliminated all but a fraction (1–2%) of the old-growth forests over a century ago (Davis, 1996). Most mature forest types in this region lack protections, many are not on federal lands, and most are fragmented especially given that large IRAs are mostly in western regions. Additionally, the USDA Forest Service (2022) revised its 20-year forest management plans for the 416,000 ha Nantahala and Pisgah National Forest in western North Carolina claiming that they needed to log mature forests to create a diversity of seral stages even though classic old-growth forests are still well below historical levels (Davis, 1996). A combination of federal protections, improved forestry practices, and conservation incentives on non-federal lands are needed in this region to meet conservation targets for MOG.
Under the Trump administration, the USDA Forest Service removed protections for large diameter (>50 cm dbh, up to 150 years old) trees on national forests in eastern Oregon and Washington that were in place for over two decades, even though large trees remain below historical levels (Mildrexler et al., 2020). We recommend restoring those protections. The five state western proposal that includes the Northern Rockies Ecosystem Protection Act also contains nearly 11 M ha of MOG with only 20% in GAP1 and 2 status and another 30% in IRAs (GAP2.5). Recent policy and management decisions underscore the importance of increasing MOG protections in this region as well.
Non-federal lands
Family forest owners are a group of nearly 10 million families, trusts, and estates representing the largest landowner category in the United States with one-third of the total forest ownership (vonHedemann and Schultz, 2021). Substantial area of at-risk ecosystems, at-risk species, and drinking water also occur on these lands mostly in the eastern states where federal lands are scarce. Family landowners generally tend to manage their forests for aesthetics, wildlife, conservation, and family ownership legacy providing opportunities for conservation investments (Butler et al., 2016).
State lands are under state regulatory authorities and these vary widely in the extent to which they have as either policy or practice the protection of MOG. Aside from state parks, most forested states grant preference to intensive forest management over forest protections. Large corporate landowners manage forests mainly to maximize their return-on-investment by cutting trees when they approach culmination of mean annual increment (just before they reach maturity). MOG therefore are often looked at as a financial liability to be converted into fast growing monocultural plantations on short-timber rotation cycles. Many tribal lands also have timber objectives. In the Great Lakes, however, larger Indian reservations contain more MOG, higher biomass, and better sustain biodiversity than surrounding public lands (Waller and Reo, 2018).
In general, for all non-federal lands, a combination of regulatory improvements and incentives could retain more MOG (Dreiss and Malcolm, 2022). This might include conservation easements, fee-title acquisitions, and carbon offsets that result in verifiable conservation gains over status quo management. Our MOG assessment may also provide procurement guidance to the private sector regarding avoiding logging in older forests, as, for example, a recent shareholder resolution at the Home Depot chain to purchase wood not coming from old-growth forests16 (accessed May 20, 2022).
Data and model limitations
A limitation of our modeled forest structural maturity is that it does not directly provide a measure of forest stand age. Such an effort would need to cross-walk our modeled MOG areas with on-the-ground forest plot metrics derived from the FIA dataset. However, our structural maturity levels (Young, Intermediate, and MOG) overlap well with the FIA Structural Stage Classification levels (Pole, Mature, and Late) and are reasonably indicative of forest age classes.
We assumed that for a given Forest Type Group in a given ecoregion, the level of maturity would be monotonically related to increasing canopy cover, canopy height and biomass. An initial visual inspection of the modeled forest maturity map identified two landscape settings where the forest was likely erroneously assigned a younger structural class. One was forests bordering the alpine zone that naturally have a sparser and shorter canopy and support lower biomass stocks compared to a similar type at a lower elevation. Less obviously, are forests in climatically drier ecoregions on exposed topographic positions that naturally would be sparser, shorter and have less biomass than similar forest types nearby with higher site productivity (McKenney and Pedlar, 2003). The Oak/Hickory Forest Type Group also had some anomalous results with lower-than-expected areas of Young forest. This is likely the result of substantial wildfire suppression in these fragmented forests across their range (Nowacki and Abrams, 2008).
The Forest Type Groups, stratified by United States Ecoregions Level III, were used to represent the major differences in forest ecosystems. However, as these Groups are only intended to indicate broad distribution patterns of forest cover in the United States, modeled with an overall accuracy of 65% (Ruefenacht et al., 2008). They represent a highly generalized level of ecological organization within which resides a rich forest biodiversity that encompasses a range of natural variability in tree growth rates due to local physical environmental conditions that means in some locations there can be a mismatch between stand development and forest structure.
Discretion should be taken when interpreting the MOG water overlay given the differing spatial scale of input datasets. The relative importance to surface drinking water dataset is provided at the scale of subwatersheds, which vary in size and shape as their bounds are largely determined by topographic and hydrologic features of the landscape (USGS et al., 2013). So, while we presented the water importance overlay at 30-m resolution, the masked values are from the coarser dataset, meaning there may be some fine-scale variation missed. There may also be some correlation between MOG area and areas highly valuable for surface drinking water, as the layer incorporates forest metrics including forest cover, forest ownership and insect and disease risk (Mack et al., 2022). Given that the index incorporates many other non-forest variables, the impact of this correlation is likely minimal.
Finally, we did not assess the critical landscape and climate refugia role that larger and more continuous MOG (e.g., IRAs) play in a rapidly changing climate, including enabling species movements (i.e., connectivity up and down elevation, northern latitudinal shifts) and providing minimum critical areas for apex predators and other area and climate sensitive species.
Conservation recommendations
President Biden’s Executive Order (White House, 2022) for forests aims to “institutionalize climate-smart management and conservation strategies that address threats to mature and old-growth forests on Federal lands.” Mature forests, which include the old-growth forest class, provide superior values compared to logged forests as natural climate solutions (Griscom et al., 2017; Moomaw et al., 2019) in meeting both White House (2021, 2022) executive orders. Moreover, the 30 × 30 executive order includes all lands and waters—and not just federal—that require a combination of conservation measures to achieve this target (e.g., in regions with little federal lands such as the eastern region). However, the current status quo management of MOG and low protection levels on all lands presents unacceptable risks at a time when the global community is seeking ways to reduce the rapidly accelerating biodiversity and climate crises (Ripple et al., 2021). While our analysis presented three target scenarios of 30, 50, and 100% protection, there are climate, biodiversity, and drinking water benefits for choosing the upper bound 100% target for MOG on federal lands with additional measures on non-federal lands to compliment a federal reserve system anchored in MOG. The IRA component of MOG includes remaining relatively intact forest blocks that would benefit from elevating the GAP status of IRAs through enhanced protective measures. One way to do this would be to introduce national rulemaking that protects all remaining federal MOG in and out of IRAs. We note that the White House (2022) also calls for prioritizing the restoration of old-growth forests as “climate-smart forest stewardship.” In our view, this can include allowing mature forests to grow into old growth structurally over time as in the Eastern region in order to begin restoring the national and regional deficits in old-growth forests. It can also mean restoring the beneficial role of wildfires in maintaining diverse understories in fire-adapted older forests such as many dry mixed conifer, oak-hickory, and open pine systems (e.g., long-leaf pine wiregrass). Typically, MOG that have experienced severe natural disturbance are logged, including within administrative reserves (such as late-successional reserves under the Northwest Forest Plan in the Pacific Northwest) and even within IRAs. However, we recommend protections extend through post-disturbance successional stages to allow forests to recover carbon stocks (proforestation, Moomaw et al., 2019) and because most carbon in severe disturbances simply transfers from live to dead pools and soils (Law et al., 2021).
A large-scale effort to protect MOG nationwide, including all primary and old-growth forests within the highest end of the mature forest spectrum, would help the United States meet a range of multilateral commitments related to protecting and restoring ecosystem integrity. Ecosystem integrity has long been a bedrock principle in the United Nations, recognized in both the Rio Declaration and Agenda 21, and were agreed to in 1992 at the United Nations Conference on Environment and Development (UNCED) (the ‘Earth Summit’). The UNFCCC’s Paris Agreement (UNFCCC 1/CP.21), agreed in 2015, carried forward the concept of ecosystem integrity in its preamble, and more recently the Intergovernmental Panel on Climate Change’s 6th Assessment Report made numerous references to the fundamental importance of primary forests, ecological restoration and ecosystem integrity (Intergovernmental Panel on Climate Change [IPCC], 2022). Similarly, the Convention on Biological Diversity also recognizes the importance of primary forests and ecosystem integrity via decisions 14/5 and 14/30 agreed in 2018 at its 14th Conference of the Parties. The United Nations Strategic Plan for Forests 2030 (ECOSOC Resolution 2017/4), which builds on the 2007 UN Forest Instrument (A/RES/62/98 and A/RES/70/199), emphasizes ending deforestation and preventing forest degradation as key globally priorities. The United Nations global decade on restoration was launched in 2021, following on the 2011 Bonn Challenge, with a target of 350 million ha of restoration, including a pledge of 15 million ha from the United States. The UN Sustainable Development Goals also has a goal of halting and reversing land degradation (United Nations, 2022). Finally, 95 nations, including the United States, recently agreed to support the 30 × 30 initiative as part of their COP15 Convention on Biological Diversity obligations in June 2022. Mature and old-growth forest inventories (White House, 2022) provide a foundation for introducing much needed policies that are based on the upper bound full protection for MOG, which would allow the United States to fulfill its international obligations as a leader in the global effort to end forest degradation and deforestation.
Data availability statement
The datasets presented in this study can be found in online repositories and on matureforests.org; accessed September 9, 2022. The names of the repository/repositories and accession number(s) can be found in the article/Supplementary material.
Ethics statement
Written informed consent was obtained from the individual(s) for the publication of any identifiable images or data included in this article.
Author contributions
BR contribute to the development of the article’s methods that were added per reviewers request for more on the methodology – the methods were greatly expanded in the article and the online Supplementary material. All authors contributed to its completion.
Funding
This project was supported by a grant from One Earth to DD and BM and support from the Sweetgrass Foundation, Lisa & Douglas Goldman Fund, Weeden Foundation, Goatie Foundation, Wilburforce Foundation, and Forest-carbon Coalition to DD.
Acknowledgments
We thank Jim Strittholt for consult on databasin.org, and over 40 workshop participants in testing forest mapping methodologies.
Conflict of interest
The authors declare that the research was conducted in the absence of any commercial or financial relationships that could be construed as a potential conflict of interest.
Publisher’s note
All claims expressed in this article are solely those of the authors and do not necessarily represent those of their affiliated organizations, or those of the publisher, the editors and the reviewers. Any product that may be evaluated in this article, or claim that may be made by its manufacturer, is not guaranteed or endorsed by the publisher.
Supplementary material
The Supplementary Material for this article can be found online at: https://www.frontiersin.org/articles/10.3389/ffgc.2022.979528/full#supplementary-material
Footnotes
- ^ https://ktvz.b-cdn.net/2022/02/2022-02-17-DOI-and-USDA-Old-Growth.pdf
- ^ https://www.climate-forests.org/
- ^ https://forestcarboncoalition.org/
- ^ https://www.oneearth.org/the-global-safety-net-a-blueprint-to-save-critical-ecosystems-and-stabilize-the-earths-climate/
- ^ https://data.fs.usda.gov/geodata/edw/datasets.php?xmlKeyword=roadless
- ^ https://data.fs.usda.gov/geodata/edw/datasets.php
- ^ https://irma.nps.gov/DataStore/Reference/Profile/2224545?lnv=True
- ^ https://www.usgs.gov/programs/gap-analysis-project/science/pad-us-data-download
- ^ https://www.fs.usda.gov/rds/archive/products/RDS-2020-0044/_metadata_RDS-2020-0044.html
- ^ https://explorer.natureserve.org/
- ^ https://www.epa.gov/climate-indicators/climate-change-indicators-us-greenhouse-gas-emissions
- ^ https://www.usda.gov/sites/default/files/documents/usda-strategic-plan-2018-2022.pdf
- ^ https://www.climate-forests.org/worth-more-standing
- ^ https://www.congress.gov/bill/115th-congress/house-bill/2936/text/ih?overview=closed&format=txt
- ^ https://www.blm.gov/programs/national-conservation-lands
- ^ https://ir.homedepot.com/~/media/Files/H/HomeDepot-IR/2022/2022%20Proxy%20Statement%20-%20Final.pdf
References
Alverson, W. S., Kuhlmann, W., and Waller, D. M. (1994). Wild Forests: Conservation Biology and Public Policy. Washington, DC: Island Press.
Bader, M. (2000). Distribution of grizzly bears in the U.S. Northern Rockies. Northwest Sci. 74, 325–334.
Betts, M. G., Phalan, B., Rousseau, J. S., and Yang, Z. (2017). Old-growth forests buffer climate-sensitive bird populations from warming. Divers. Distrib. 24, 439–447. doi: 10.1111/ddi.12688
Brown, S., Schroeder, P., and Birdsey, R. (1997). Aboveground biomass distribution of US eastern hardwood forests and the use of large trees as an indicator of forest development. For. Ecol. Manag. 96, 37–47. doi: 10.1016/S0378-1127(97)00044-3
Butler, B. J., Hewes, J. H., Dickinson, B. J., Andrejczyk, K., Butler, S. M., and Markowski-Lindsay, M. (2016). Family forest ownerships of the United States, 2013: Findings from the USDA Forest Service’s National Woodland Owner survey. J. For. 114, 638–647. doi: 10.5849/jof.15-099
Cannon, C. H., Piovesan, G., and Munné-Bosch, S. (2022). Old and ancient trees are life history lottery winners and vital evolutionary resources for long-term adaptive capacity. Nat. Plants 8, 136–145. doi: 10.1038/s41477-021-01088-5
Carleton, T. J. (2003). Old growth in the Great Lakes forest. Environ. Rev. 11:S115–S134. doi: 10.1139/a03-009
Carroll, C., and Noss, R. F. (2021). How percentage-protected targets can support positive biodiversity outcomes. Conserv. Biol. 36:e13869. doi: 10.1111/cobi.13869
Carroll, C., and Ray, J. C. (2021). Maximizing the effectiveness of national commitments to protected area expansion for conserving biodiversity and ecosystem carbon under climate change. Glob. Change Biol. 27, 3395–3414. doi: 10.1111/gcb.15645
CIDAC (1990). Carbon Dioxide Information Analysis Center – Conversion Tables. Available Online at: https://web.archive.org/web/20170118004650/http:/cdiac.ornl.gov/pns/convert.html (accessed Sept 5, 2022).
Comer, P. J., Hak, J. C., and Seddon, E. (2022). Documenting at-risk status of terrestrial ecosystems in temperate and tropical North America. Conserv. Sci. Pract. 4:e603. doi: 10.1111/csp2.603
Crampe, E. A., Segura, C., and Jones, J. A. (2021). Fifty years of runoff response to conversion of old-growth forest to planted forest in the J.J. Andrews Forest, Oregon, USA. Hydrol. Process. doi: 10.1002/hyp.14168
Davis, M. B. (ed.) (1996). Eastern old-Growth Forests. Prospects for Rediscovery and Recovery. Washington, D.C: Island Press.
De Frenne, P., Rodríguez-Sánchez, F., Coomes, D. A., Baeten, L., and Verheyen, K. (2013). Microclimate moderates plant responses to macroclimate warming. Proc. Natl. Acad. Sci. U.S.A. 110, 18561–18565. doi: 10.1073/pnas.1311190110
DellaSala, D. A., Brandt, P., Koopman, M., Leonard, J., Meisch, C., Herzog, P., et al. (2015). “Climate Change May Trigger Broad Shifts in North America’s Pacific Coastal Rainforests,” in Reference Module in Earth Systems and Environmental Sciences, eds D. A. DellaSala and M. I. Goldstein (Amsterdam: Elsevier).
DellaSala, D. A. (ed.) (2011). Temperate And Boreal Rainforests Of The World: Ecology And Conservation. doi: 10.5822/978-1-61091-008-8 Washington, D.C: Island Press.
DellaSala, D. A., Gorelik, S. R., and Walker, W. S. (2022). The Tongass National Forest, southeast Alaska, USA: A natural climate solution of global significance. Land 11:717. doi: 10.3390/land11050717
DellaSala, D. A., Kormos, C., Keith, H., and Mackey, B. (2020). Primary forests are undervalued in the climate emergency. Bioscience 70, 445. doi: 10.1093/biosci/biaa030
Dinerstein, E., Vynne, C., Sala, E., Joshi, A. R., Fernando, S., Lovejoy, T. E., et al. (2019). A global deal for nature: Guiding principles, milestones, and targets. Sci. Adv. 5:eaaw2869. doi: 10.1126/sciadv.aaw2869
Dreiss, L. M., and Malcolm, J. W. (2022). Identifying key federal, stage, and private lands strategies for achieving 30 x 30 in the United States. Conserv. Lett. 15:e12849. doi: 10.1111/conl.12849
Ducey, M. J., Whitman, A. A., and Gunn, J. (2013). Late-successional and old-growth forests in the northeastern United States: Structure, dynamics, and prospects for restoration. Forests 4, 1055–1086.
FIA (2022). Forest Inventory and Analysis (FIA) program of the USDA Forest Service. Research and Development Deputy Area of the U.S. Available Online at: https://www.fia.fs.usda.gov/ (accessed Sep 5, 2022).
Franklin, J. F., and Van Pelt, R. (2004). Spatial aspects of structure complexity in old-growth forests. J. For. 102, 22–28.
Frey, S. J. K., Hadley, A. S., Johnson, S. L., Schulze, M., Jones, J. A., and Betts, M. G. (2016). Spatial models reveal the microclimatic buffering capacity of old-growth forests. Sci. Adv. 2016:e1501392. doi: 10.1126/sciadv.1501392
Gorelick, N., Hancher, M., Dixon, M., Ilyushchenko, S., Thaud, D., and Moore, R. (2017). Google Earth Engine: Planetary-scale geospatial analysis for everyone. Remote Sens. Environ. 202, 18–27. doi: 10.1016/j.rse.2017.06.031
Griscom, B. W., Adams, J., Ellis, P. W., Houghton, R. A., Lomax, G., Miteva, D. A., et al. (2017). Natural climate solutions. Proc. Natl. Acad. Sci. U.S.A. 114, 11645–11650. doi: 10.1073/pnas.1710465114
Gunn, J. S., Ducey, M. J., and Whitman, A. A. (2013). Late-successional and old-growth forest carbon temporal dynamics in the Northern Forest (Northeastern USA). For. Ecol. Manag. 312, 40–46. doi: 10.1016/j.foreco.2013.10.023
Hanberry, B. B., Brzuskek, R. F., Foster, H. T., and Schauwecker, F. J. (2018). Recalling open old growth forests in the southeastern mixed forest province of the United States. Ecoscience. 26, 1–12. doi: 10.1080/1195860.2018.1499282
Hansen, M. C., Potapov, P. V., Moore, R., Hancher, M., Turubanova, S. A., Tyukavina, A., et al. (2013). High-resolution global maps of 21st-century forest cover change. Science 342, 850–853. doi: 10.1126/science.1244693
Harris, N. L., Gibbs, D. A., Baccini, A., Birdsey, R. A., De Bruin, S., Farina, M., et al. (2021). Global maps of twenty-first century forest carbon fluxes. Nat. Clim. Change 11, 234–240. doi: 10.1038/s41558-020-00976-6
Heilman, G. E., Strittholt, J. R., Slosser, N. C., and DellaSala, D. A. (2002). Forest fragmentation of the conterminous United States: Assessing forest intactness through road density and spatial characteristics. Bioscience 52, 411–422. doi: 10.1641/0006-3568(2002)052[0411:FFOTCU]2.0.CO;2
Intergovernmental Panel on Climate Change [IPCC] (2022). Climate Change 2022: Impacts, Adaptation And Vulnerability. Available Online at: https://www.ipcc.ch/report/sixth-assessment-report-working-group-ii/ (accessed March 22, 2022).
IUCN (2020). Policy On Primary Forests And Intact Forest Landscapes. Available Online at: https://www.iucn.org/sites/dev/files/content/documents/iucn_pf-ifl_policy_2020_approved_version.pdf (accessed May 15, 2022).
Kauffman, M. R., Binkley, D., Fule, P. Z., Johnson, M., Stephens, S. L., and Swetnam, T. W. (2007). Defining old growth for fire-adapted forests of the western United States. Ecol. Soc. 12:15. doi: 10.5751/ES-02169-120215
Kauffman, M. R., Moir, W. H., and Bassett, R. L. (1992). Old-growth forests in the southwest and Rocky Mountain Regions Proceedings of a Workshop. Techn. Rept. RM-213, Washington, DC: USDA Forest Service Gen. doi: 10.2737/RM-GTR-213
Keith, H., Lindenmayer, D., Mackey, B., Blair, D., Carter, L., McBurney, L., et al. (2014). Managing temperate forests for carbon storage: Impacts of logging versus forest protection on carbon stocks. Ecosphere 5:75. doi: 10.1890/ES14-00051.1
Keith, H., Mackey, B., Berry, S., Lindenmayer, D., and Gibbons, P. (2010). Estimating carbon carrying capacity in natural forest ecosystems across heterogenous landscapes: Addressing sources of error. Glob. Change Biol. 16, 2971–2989. doi: 10.1111/j.1365-2486.2009.02146.x
Keith, H., Mackey, B., Kun, Z., Mikolas, M., Svitok, M., and Svoboda, M. (2022). Evaluating the mitigation effectectiveness of forests managed for conservation versus commodity production using an Australian example. Conserv. Lett. 2022:e12878. doi: 10.1111/conl.12878
Keith, H., Mackey, B. G., and Lindenmayer, D. B. (2009). Re-evaluation of forest biomass carbon stocks and lessons from the world’s most carbon-dense forests. Proc. Natl. Acad. Sci. U.S.A. 106, 11635–11640. doi: 10.1073/pnas.0901970106
Krankina, O., DellaSala, D. A., Leonard, J., and Yatskov, M. (2014). High biomass forests of the Pacific Northwest: Who manages them and how much is protected? Environ. Manag. 54, 112–121. doi: 10.1007/s00267-014-0283-1
LANDFIRE (2016). LF 2016 Maps. Available Online at: https://landfire.gov/ (accessed May 15, 2022).
Law, B. E., Berner, L. T., Buotte, P. C., Mildrexler, D. J., and Ripple, W. J. (2021). Strategic forest reserves can protect biodiversity in the western United States and mitigate climate change. Commun. Earth Environ. 2:254. doi: 10.1038/s43247-021-00326-0
Law, B. E., Moomaw, W. R., Hudiburg, T. W., Schlesinger, W. H., Sternman, J. D., and Woodwell, G. M. (2022). Creating strategic reserves to protect forest carbon and reduce biodiversity losses in the United States. Land 2022:721. doi: 10.3390/land11050721
Lawrence, D., Coe, M., Walker, W., Verchot, L., and Vandecar, K. (2022). The unseen effects of deforestations: Biophysical effects on climate. Front. For. Glob. 5:756115. doi: 10.3389/ffgc.2022.756115
Leak, W. B., and Yamasaki, M. (2012). Historical (1899) Age and Structural Characteristics of an Old-Growth Northern Hardwood Stand in New York State. Res. Note NRS-144. Newtown Square, PA: U.S. Department of Agriculture. doi: 10.2737/NRS-RN-144
Lesmeister, D. B., Davis, R. J., Sovern, S. G., and Yang, Z. (2021). Northern spotted owl nesting forests as fire refugia: A 30-year synthesis of large wildfires. Fire Ecol. 17:32. doi: 10.1186/s42408-021-00118-z
Lindenmayer, D. B., Laurance, W. F., and Franklin, J. F. (2012). Global decline in large old trees. Science 338, 1305–1306. doi: 10.1126/science.1231070
Lindenmayer, D. B., Laurance, W. F., Franklin, J. F., Likens, G. E., Banks, S. C., Blanchard, W., et al. (2014). New policies for old trees: Averting a global crisis in a keystone ecological structure. Conserv. Lett. 7, 61–69. doi: 10.1111/conl.12013
Lutz, J. A., Furnis, T. J., Johnson, D. J., Davies, S. J., Allen, D., Alonson, A., et al. (2018). Global importance of large-diameter trees. Glob. Ecol. Biogeogr. 27, 849–864. doi: 10.1111/geb.12747
Luyssaert, S., Detlef Schulz, E., Borner, A., Knohl, A., Hessenmoller, D., Law, B. E., et al. (2008). Old-growth forests as global carbon sinks. Nature 455, 213–215. doi: 10.1038/nature07276
Mack, E., Lilja, R., Claggett, S., Sun, G., and Caldwell, P. (2022). Forests To Faucets 2.0: Connecting Forests, Water And Communities. Asheville: USDA Forest Service GTR Southern Research Station, doi: 10.2737/WO-GTR-99
Mackey, B., DellaSala, D. A., Kormos, C., Lindenmayer, D., Kumpel, N., Zimmerman, B., et al. (2014). Policy options for the world’s primary forests in multilateral environmental agreements. Conserv. Lett. 8, 139–147. doi: 10.1111/conl.12120
Mayer, P., Prescott, C. E., Abaker, W. E. A., Augusto, L., Cécillon, L., Ferreira, G. W., et al. (2020). Tamm review: Influence of forest management activities on soil organic carbon stocks: A knowledge synthesis. For. Ecol. Manag. 466:118127. doi: 10.1016/j.foreco.2020.118127
McKenney, D. W., and Pedlar, J. H. (2003). Spatial models of site index based on climate and soil properties for two boreal tree species in Ontario, Canada. For. Ecol. Manag. 175, 497–507. doi: 10.1016/S0378-1127(02)00186-X
Mildrexler, D. J., Berner, L. T., Law, B. E., Birdsey, R. A., and Moomaw, W. R. (2020). Large trees dominate carbon storage in forests east of the Cascade Crest in the United States Pacific Northwest. Front. For. Glob. Change 3:594274. doi: 10.3389/ffgc.2020.594274
Moomaw, W. R., Masino, S. A., and Faison, E. K. (2019). Intact forests in the United States: Proforestation mitigates climate change and serves the greatest good. Front. For. Glob. Change 2:27. doi: 10.3389/ffgc.2019.00027
National Geographic (2021). The U.S. Commits to Tripling its Protected lands. Here’s how it Could be Done. Available Online at: https://www.nationalgeographic.com/environment/article/biden-commits-to-30-by-2030-conservation-executive-orders#:~:text=DEFENDERS%20OF%20WILDLIFE-,Biden’s%20commitment%20to%20conserve%2030%20percent%20of%20U.S.%20land%20by,30%20by%2030%20conservation%20goal (accessed Sep 5, 2022).
Northern Rockies Ecosystem Protection Act (2021). S.1276-Northern Rockies Ecosystem Protection Act. Available Online at: https://www.congress.gov/bill/117th-congress/senate-bill/1276/text (accessed April 15, 2022).
Noss, R. F., Dobson, A. P., Baldwin, R., Beier, P., Davis, C. R., DellaSala, D. A., et al. (2012). Bolder thinking for conservation. Conserv. Biol. 26, 1–4. doi: 10.1111/j.1523-1739.2011.01738.x
Nowacki, G. J., and Abrams, M. D. (2008). The demise of fire and “mesophication” of forests in the eastern United States. Bioscience 58, 123–138. doi: 10.1641/B580207
Omernik, J. M., and Griffith, G. E. (2014). Ecoregions of the conterminous United States: Evolution of a hierarchical spatial framework. Environ. Manag. 54, 1249–1266. doi: 10.1007/s00267-014-0364-1
Orians, G. H., and Schoen, J. W. (eds) (2012). North Pacific Temperate Rainforests: ecology and conservation. Seattle: University of Washington Press.
Pan, Y., Chen, J. M., Birdsey, R., McCullough, K., He, L., and Deng, F. (2011). Age structure and disturbance legacy of North American forests. Biogeosciences 8, 715–732. doi: 10.5194/bg-8-715-2011
Perry, T. D., and Jones, J. A. (2016). Summer streamflow deficits from regenerating Douglas-fir forest in the Pacific Northwest, USA. Ecohydrology 10:e1790. doi: 10.1002/eco.1790
Petersen, R., Goldman, E., Harris, N., Sargent, S., Aksenov, D., Manisha, A., et al. (2016). Mapping Tree Plantations with Multispectral Imagery: Preliminary Results for Seven Tropical Countries. Washington, DC: World Resources Institute.
Potapov, P., Li, X., Hernandez-Serna, A., Tyukavina, A., Hansen, M. C., Kommardeddy, A., et al. (2021). Mapping global forest canopy height through integration of GEDI and Landsat data. Remote Sens. Environ. 253:112165. doi: 10.1016/j.rse.2020.112165
Reid, M., Harkness, M., Kittel, G., Schulz, K., and Comer, P. (2016). Documenting Relationships Between Blms Special Status Species And Their Habitats. Arlington VA: Bureau of Land Management by NatureServe. 35p + Appendices and Data Tables.
Ripple, W., Wolf, C., Newsome, T. M., Gregg, J. W., Lenton, T. M., Palomo, I., et al. (2021). World scientists’ warning of a climate emergency. Bioscience 71, 894–898. doi: 10.1093/biosci/biab079
Ruefenacht, B., Finco, M. V., Nelson, M. D., Czaplewski, R., Helmer, E. H., Blackard, J. A., et al. (2008). Conterminous US and Alaska forest type mapping using forest inventory and analysis data. Photogramm. Eng. Remote Sens. 74, 1379–1388. doi: 10.14358/PERS.74.11.1379
Sass, E. M., Butler, B. J., and Markowski-Lindsay, M. A. (2020). Forest Ownership In The Conterminous United States Circa 2017: Distribution Of Eight Ownership Types – Geospatial Dataset. Fort Collins, CO: Forest Service Research Data Archive, doi: 10.2737/RDS-2020-0044
Shifley, S. R., Roovers, L. M., and Brookshire, B. L. (1995). “Structural and compositional differences between old-growth and mature second-growth forests in the Missouri Ozarks,” in Proceedings, 10th Central Hardwood Forest Conference, eds K. W. Gottschalk and S. L. C. Fosbroke (Radnor, PA: U.S. Department of Agriculture).
Spies, T. A. (2004). Ecological concepts and diversity of old-growth forests. J. For. 102, 14–20. doi: 10.1111/brv.12470
Stein, B. A., Kutner, L. S., and Adams, J. S. (eds) (2000). Precious Heritage: The Status of Biodiversity in the United States. New York, NY: Oxford University Press. doi: 10.1093/oso/9780195125191.001.0001
Stephenson, N. L. D. A. J., Condit, R., Russo, S. E., Baker, P. J., Beckman, N. G., Coomes, D. A., et al. (2014). Rate of tree carbon accumulation increases continuously with tree size. Nature 507, 90–93. doi: 10.1038/nature12914
Strittholt, J. R., DellaSala, D. A., and Jiang, H. (2006). Status of mature and old-growth forests in the Pacific Northwest. Conserv. Biol. 20, 363–374. doi: 10.1111/j.1523-1739.2006.00384.x
U.S. Geological Survey [USGS], and Gap Analysis Project [GAP] (2020). Protected Areas Database of the United States (PAD-US) 2.1. Reston: U.S. Geological Survey data release.
UNFCCC (2021). United Nations Glasgow Climate Summit. Available Online at: https://unfccc.int/process-and-meetings/conferences/glasgow-climate-change-conference-october-november-2021/outcomes-of-the-glasgow-climate-change-conference (accessed May 28, 2022).
United Nations (2022). Sustainability Goal 15. Available Online at: https://sdgs.un.org/goals/goal15 (accessed May 28, 2022).
United Nations Climate Change (2021). Glasgow Leaders’ Declaration on Forests and Land Use. (2021). UN 2104 Clim. Change Conf. COP26SEC—Glasg. 2021. Available Online at: https://ukcop26.org/glasgow-leaders-declaration-on-forests-and-land-use/ (accessed on April 19, 2022).
USDA Forest Service (2022). Nantahala and Pisgah National Forests. R8-MB-160. Available Online at: https://www.fs.usda.gov/Internet/FSE_DOCUMENTS/fseprd987300.pdf (accessed May 15, 2022).
USGS, USDA, and NRCS (2013). Federal Standards And Procedures For The National Watershed Boundary Dataset (Wbd). Lakewood: US Geological Survey Techniques and Methods.
vonHedemann, N., and Schultz, C. (2021). U.S. family forest owners’ forest management for climate adaptation: Perspectives from extension and outreach specialists. Front. Clim. 3:674718. doi: 10.3389/fclim.2021.674718
Vynne, C., Dovichin, E., Fresco, N., Dawson, N., JoshL, A., Law, B. E., et al. (2021). The importance of Alaska for climate stabilization, resilience, and biodiversity conservation. Front. For. Glob. Change 4:701277. doi: 10.3389/ffgc.2021.701277
Waller, D. M., and Reo, N. J. (2018). First stewards: Ecological outcomes of forest and wildlife stewardship by indigenous peoples of Wisconsin, USA. Ecol. Soc. 23:45. doi: 10.5751/ES-09865-230145
White House (2021). Executive Order on Catalyzing Clean Energy Industries and Jobs Through Federal Sustainability. Available Online at: https://www.whitehouse.gov/briefing-room/presidential-actions/2021/12/08/executive-order-on-catalyzing-clean-energy-industries-and-jobs-through-federal-sustainability/ (accessed May 28, 2022).
White House (2022). Executive Order on Strengthening the Nation’s Forests, Communities, and Local Economies. Available Online at: https://www.whitehouse.gov/briefing-room/presidential-actions/2022/04/22/executive-order-on-strengthening-the-nations-forests-communities-and-local-economies/ (accessed May 28, 2022).
Keywords: United States, mature forests, biodiversity, carbon, drinking water
Citation: DellaSala DA, Mackey B, Norman P, Campbell C, Comer PJ, Kormos CF, Keith H and Rogers B (2022) Mature and old-growth forests contribute to large-scale conservation targets in the conterminous United States. Front. For. Glob. Change 5:979528. doi: 10.3389/ffgc.2022.979528
Received: 27 June 2022; Accepted: 09 September 2022;
Published: 28 September 2022.
Edited by:
Thomas J. Dean, Louisiana State University, United StatesReviewed by:
Don Waller, University of Wisconsin System, United StatesKristin DeMarco, Louisiana State University, United States
Copyright © 2022 DellaSala, Mackey, Norman, Campbell, Comer, Kormos, Keith and Rogers. This is an open-access article distributed under the terms of the Creative Commons Attribution License (CC BY). The use, distribution or reproduction in other forums is permitted, provided the original author(s) and the copyright owner(s) are credited and that the original publication in this journal is cited, in accordance with accepted academic practice. No use, distribution or reproduction is permitted which does not comply with these terms.
*Correspondence: Dominick A. DellaSala, dominick@wild-heritage.org